3.1 P: Using the Debugger
Contents:
- What you should already KNOW
- What you will LEARN
- What you will DO
- App overview
- Task 1. Create the SimpleCalc Project and App
- Task 2. Run SimpleCalc in the Debugger
- Task 3. Explore Debugger Features
- Coding challenge
- Summary
- Related concept
- Learn more
In previous practicals you used the Log class to print information to the system log (logcat) when your app runs. Adding logging statements to your app is one way to find errors and improve your app's operation. Another way is to use the debugger built into Android Studio.
In this practical you'll learn how to debug your app in an emulator and on the device, set and view breakpoints, step through your code, and examine variables.
What you should already KNOW
From the previous practicals you should be able to:
- Create an Android Studio project, and work with EditText and Button views.
- Build and run your app in Android Studio, on both an emulator and on a device.
- Read and analyze a stack trace, including last on, first off.
- Add log statements and view the system log (logcat) in Android Monitor.
What you will LEARN
You will learn to:
- Run your app in debug mode in an emulator or on a device.
- Step through the execution of your app.
- Set and organize breakpoints.
- Examine and modify variables in the debugger.
What you will DO
In this practical, you will:
- Build the SimpleCalc app.
- Set and view breakpoints in the code for SimpleCalc.
- Step through your code as it runs.
- Examine variables and evaluate expressions.
- Identify and fix problems in the sample app.
App Overview
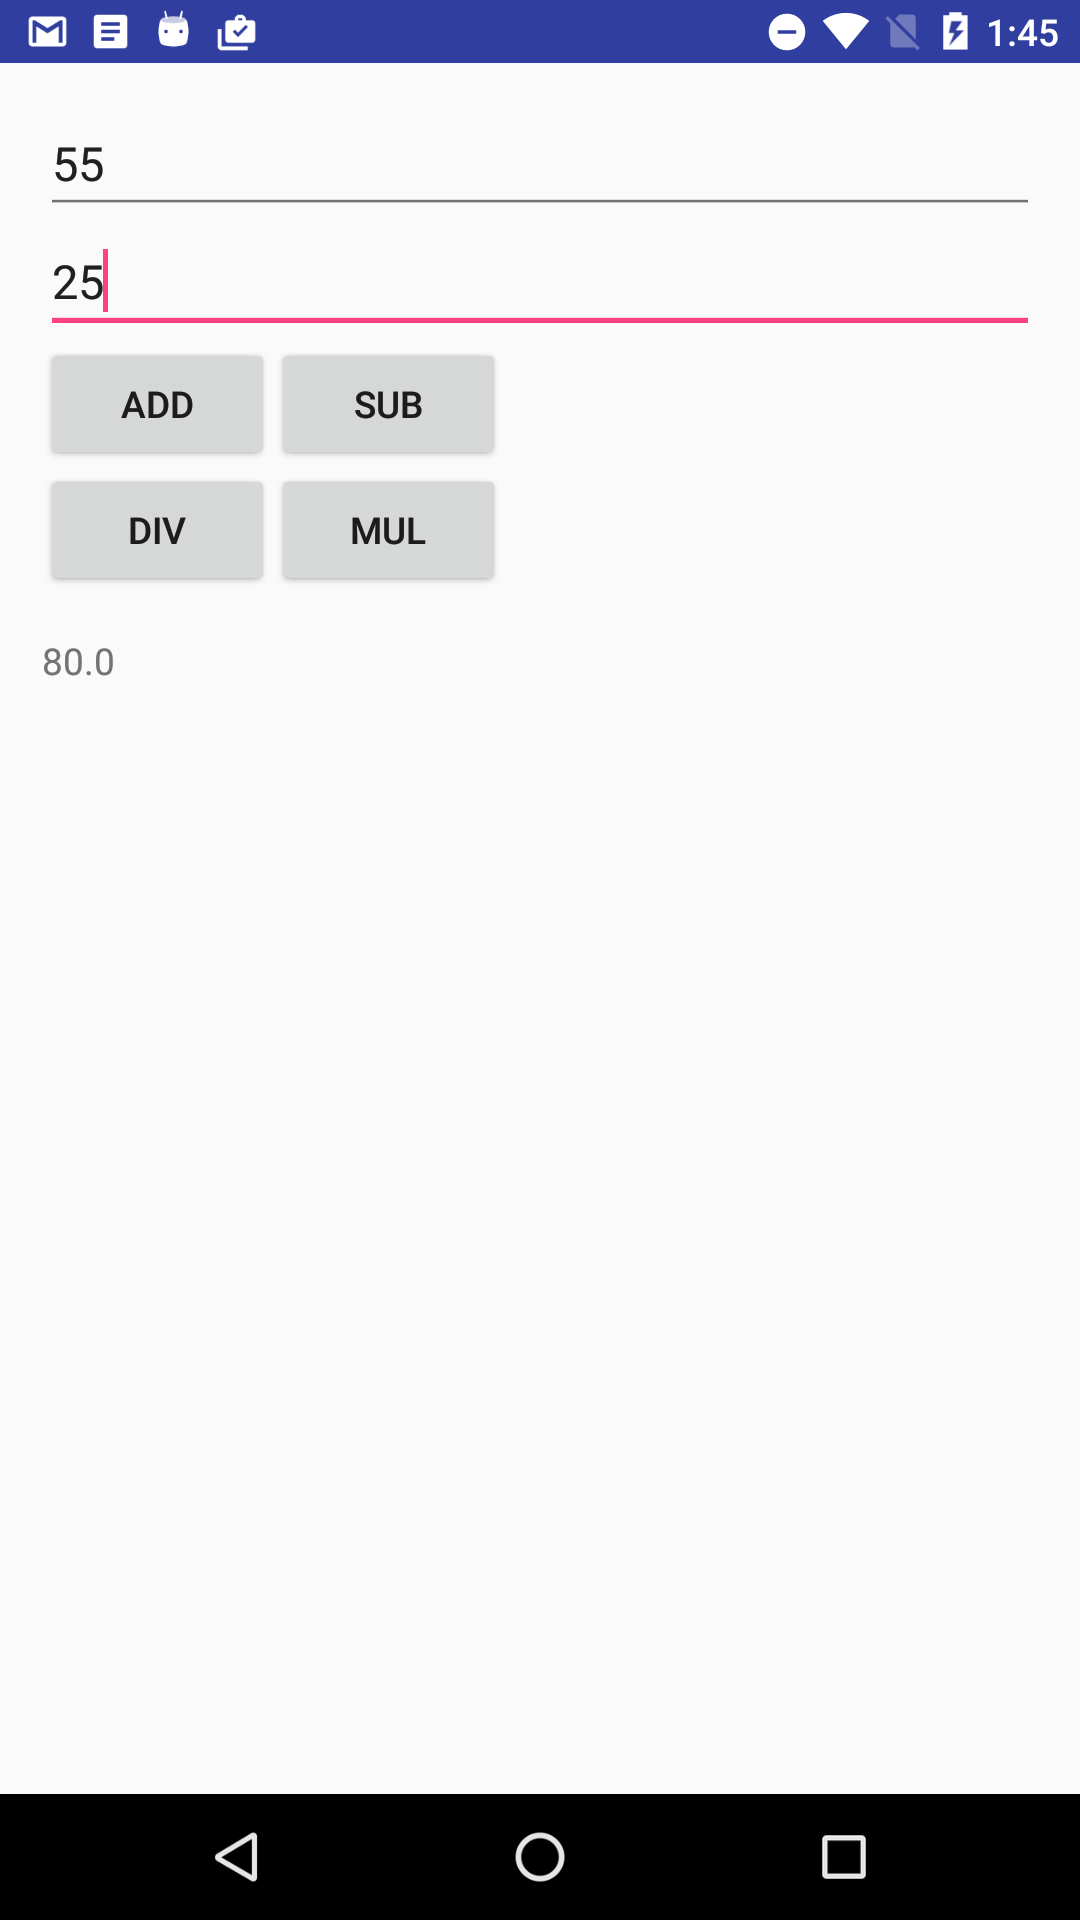
The SimpleCalc app has two edit texts and four buttons. When you enter two numbers and click a button, the app performs the calculation for that button and displays the result.
Task 1. Create the SimpleCalc Project and App
For this practical you won't build the SimpleCalc app yourself. The complete project is available at SimpleCalc. In this task you will open the SimpleCalc project into Android Studio and explore some of the app's key features.
1.1 Download and Open the SimpleCalc Project
- Download and unzip the SimpleCalc project folder.
- Start Android Studio and select File > Open.
Navigate to the folder for SimpleCalc, select that folder file, and click OK.
The SimpleCalc project builds. Open the project view if it is not already open.
Warning: This app contains errors that you will find and fix. If you run the app on a device or emulator you might run into unexpected behavior which may include crashes in the app.
1.2 Explore the Layout
- Open
res/layout/activity_main.xml. - Preview the layout in the Layout Editor.
- Examine the layout code and design and note the following:
- The layout contains two EditTexts for the input, four Button views for the calculations, and one TextViews to display the result.
- Each calculation button has it's own onClick handler (onAdd, OnSub, and so on.)
- The TextView for the result does not have any text in it by default.
- The two EditText views have the property android:inputType and the value
"numberDecimal". This property indicates that the EditText only accepts numbers as input. The keyboard that appears on screen will only contain numbers. You will learn more about input types for EditTexts in a later practical.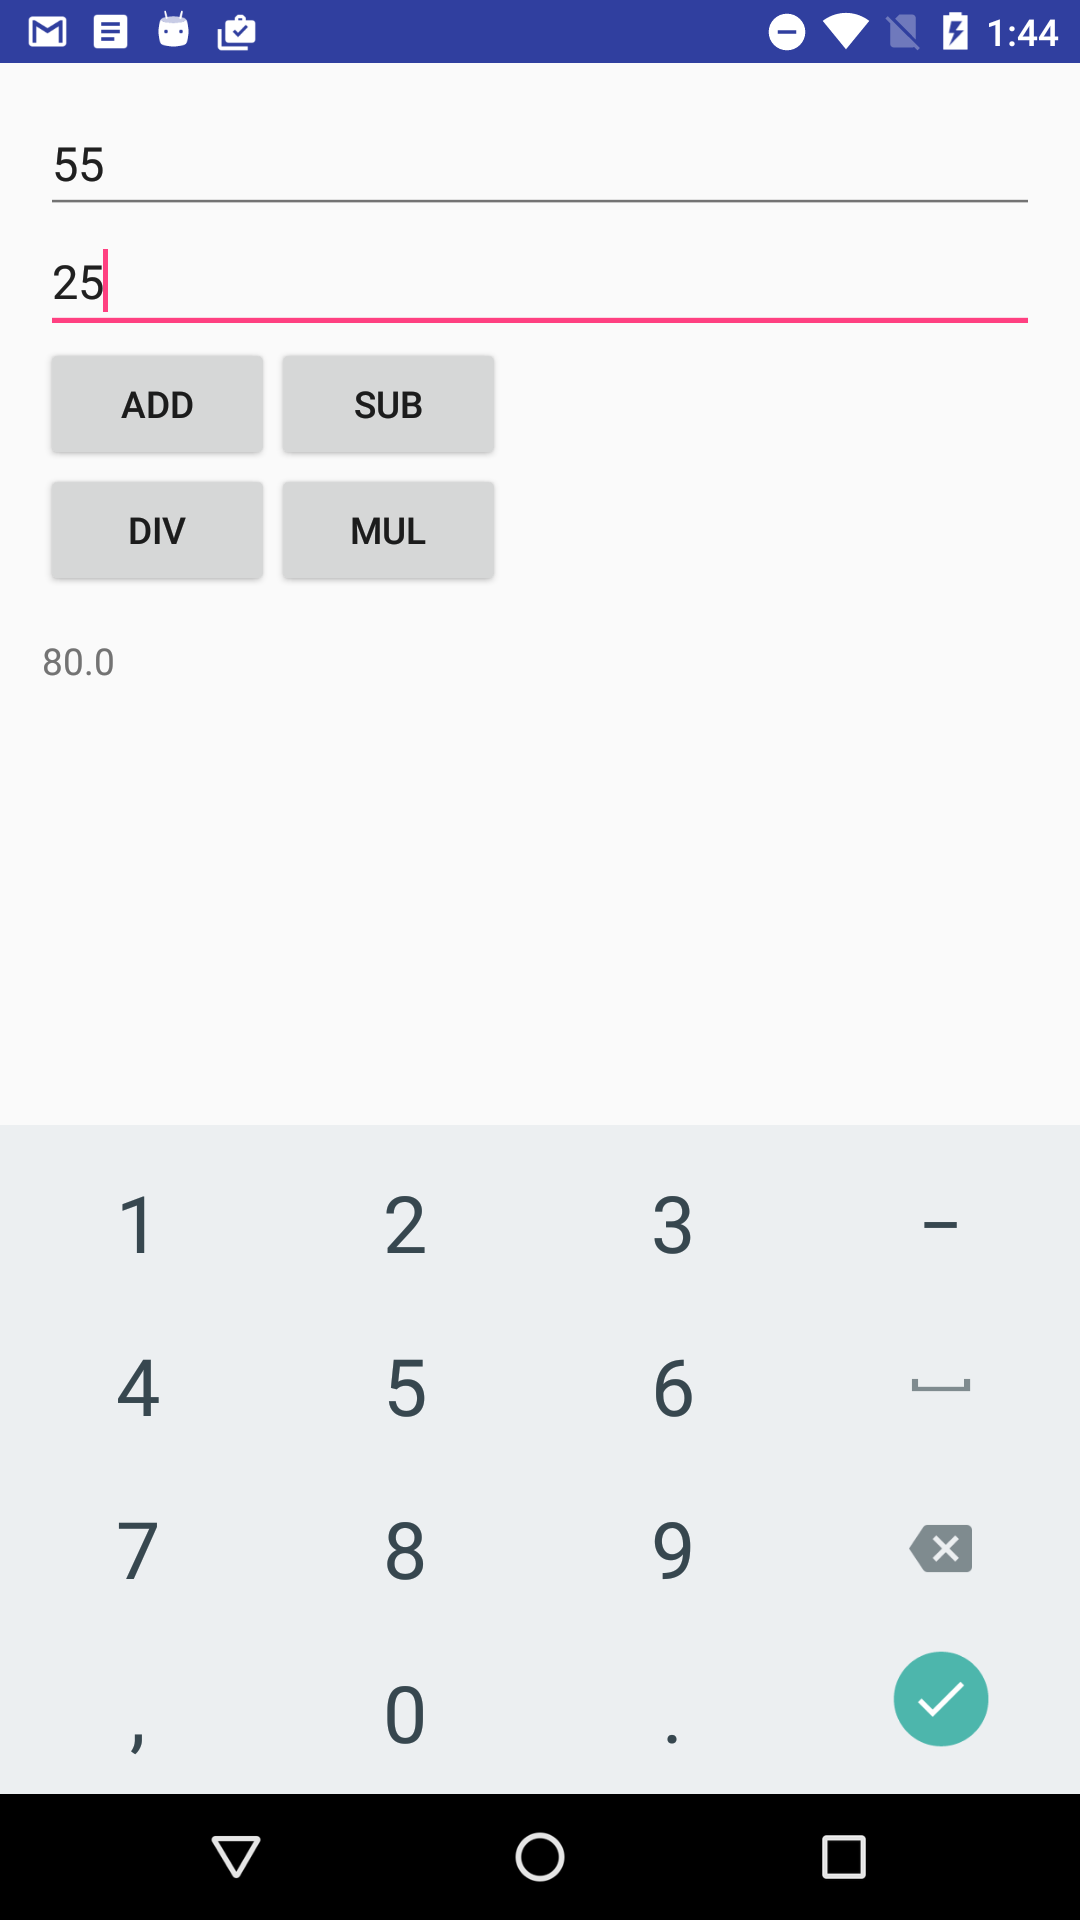
1.3 Explore the app code
- Expand the app/java folder in the Android project view. In addition to the MainActivity class, this project also includes a utility Calculator class.
- Open Calculator (java/com.example.android.simplecalc/Calculator.java). Examine the code. Upon examination, you can make the following observations:
- The operations the calculator can perform are defined by the Operator enum.
- All of the operation methods are public.
- Open MainActivity (java/com.example.android.simplecalc/MainActivity). Examine the code. What observations can you make about the code and activity? Think about your answer and confirm the following:
- All of the onClick handlers call the private compute() method, with the operation name as one of the values from the Calculator.Operator enumeration.
- The compute() method calls the private method getOperand() (which in turn calls getOperandText()) to retrieve the number values from the EditTexts.
- The compute() method then uses a switch on the operand name to call the appropriate method in the Calculator class.
- The calculation methods in the Calculator class perform the actual arithmetic and return a value.
- The last part of the compute() method updates the TextView with the result of the calculation.
- Run the app. Try these things:
- Enter both integer and floating-point values for the calculation.
- Enter floating-point values with large decimal fractions (for example, 1.6753456)
- Divide a number by zero.
- Leave one or both of the EditText views empty, and try any calculation.
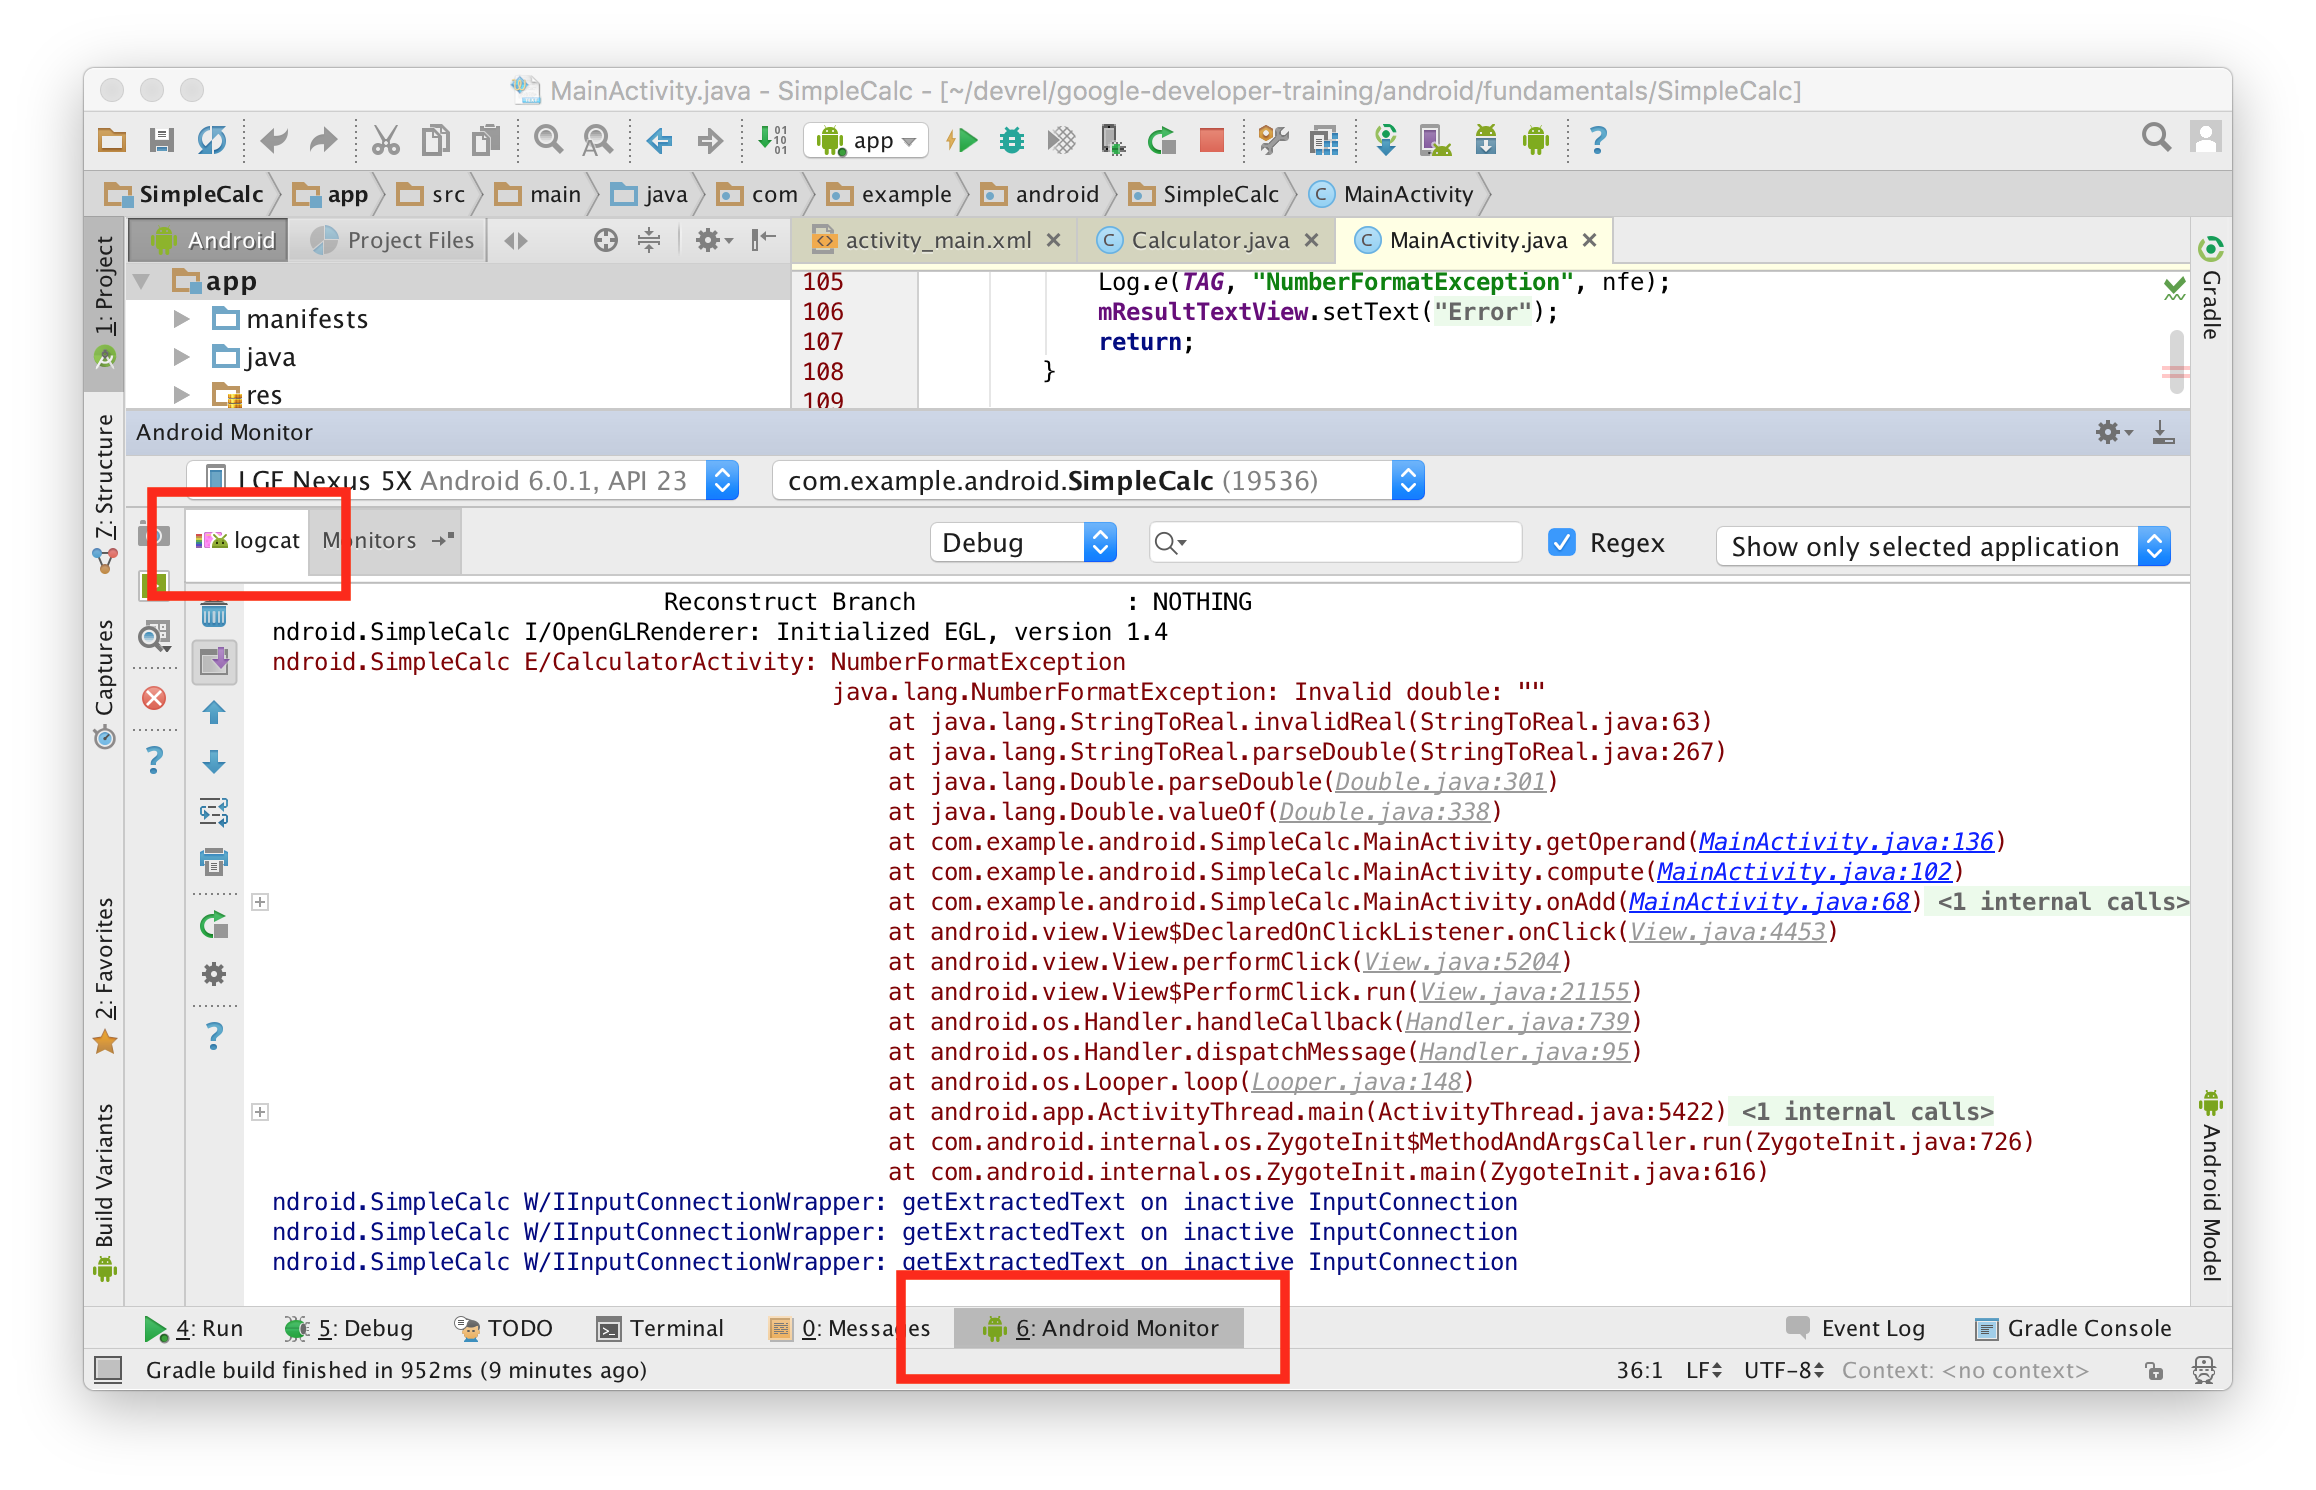
Examine the stack trace in Android Studio when the app reports an error.
If the stack trace is not visible, click the Android Monitor button at the bottom of the Android Studio, and then click logcat.
If one or both of the EditText views in SimpleCalc is empty, the app reports "Error" and the system log displays the state of the execution stack at the time the app produced the error. The stack trace usually provides important information about why an error occurred.
Coding Challenge
Challenge: Examine the stack trace and try to figure out what caused the error (but don't fix it yet.)
Task 2. Run SimpleCalc in the Debugger
In this task you'll get an introduction to the debugger in Android Studio, and learn how to run your app in debug mode.
2.1 Start and Run your app in debug mode
In Android Studio, select Run > Debug app or click the Debug icon
 in the toolbar.
If your app is already running, you will be asked if you want to restart your app in debug mode. Click Restart app.
Android Studio builds and runs your app on the emulator or on the device. Debugging is the same in either case. While Android Studio is initializing the debugger, you may see a message that says "Waiting for debugger" on the device before you can use your app.
If the Debug view does not automatically appear in Android Studio, click the Debug tab at the bottom of the screen, and then the Debugger tab.
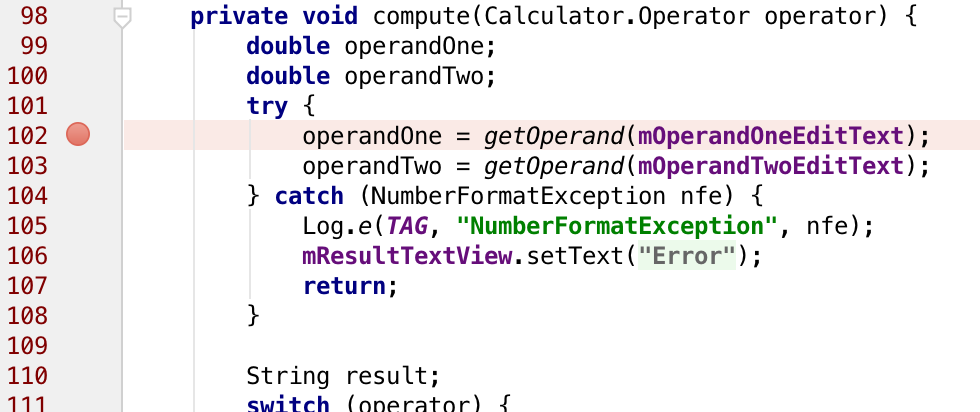
- Open the MainActivity.java file and click in the fourth line of the compute() method (the line just after the try statement).
Click in the left gutter of the editor window at that line, next to the line numbers. A red dot appears at that line, indicating a breakpoint.
You can also use Run > Toggle Line Breakpoint or Control-F8 (Command-F8 on OS X) to set or clear a breakpoint at a line.
In the SimpleCalc app on a device, enter numbers in the EditText views and click one of the calculate buttons.
The execution of your app stops when it reaches the breakpoint you set, and the debugger shows the current state of your app at that breakpoint.
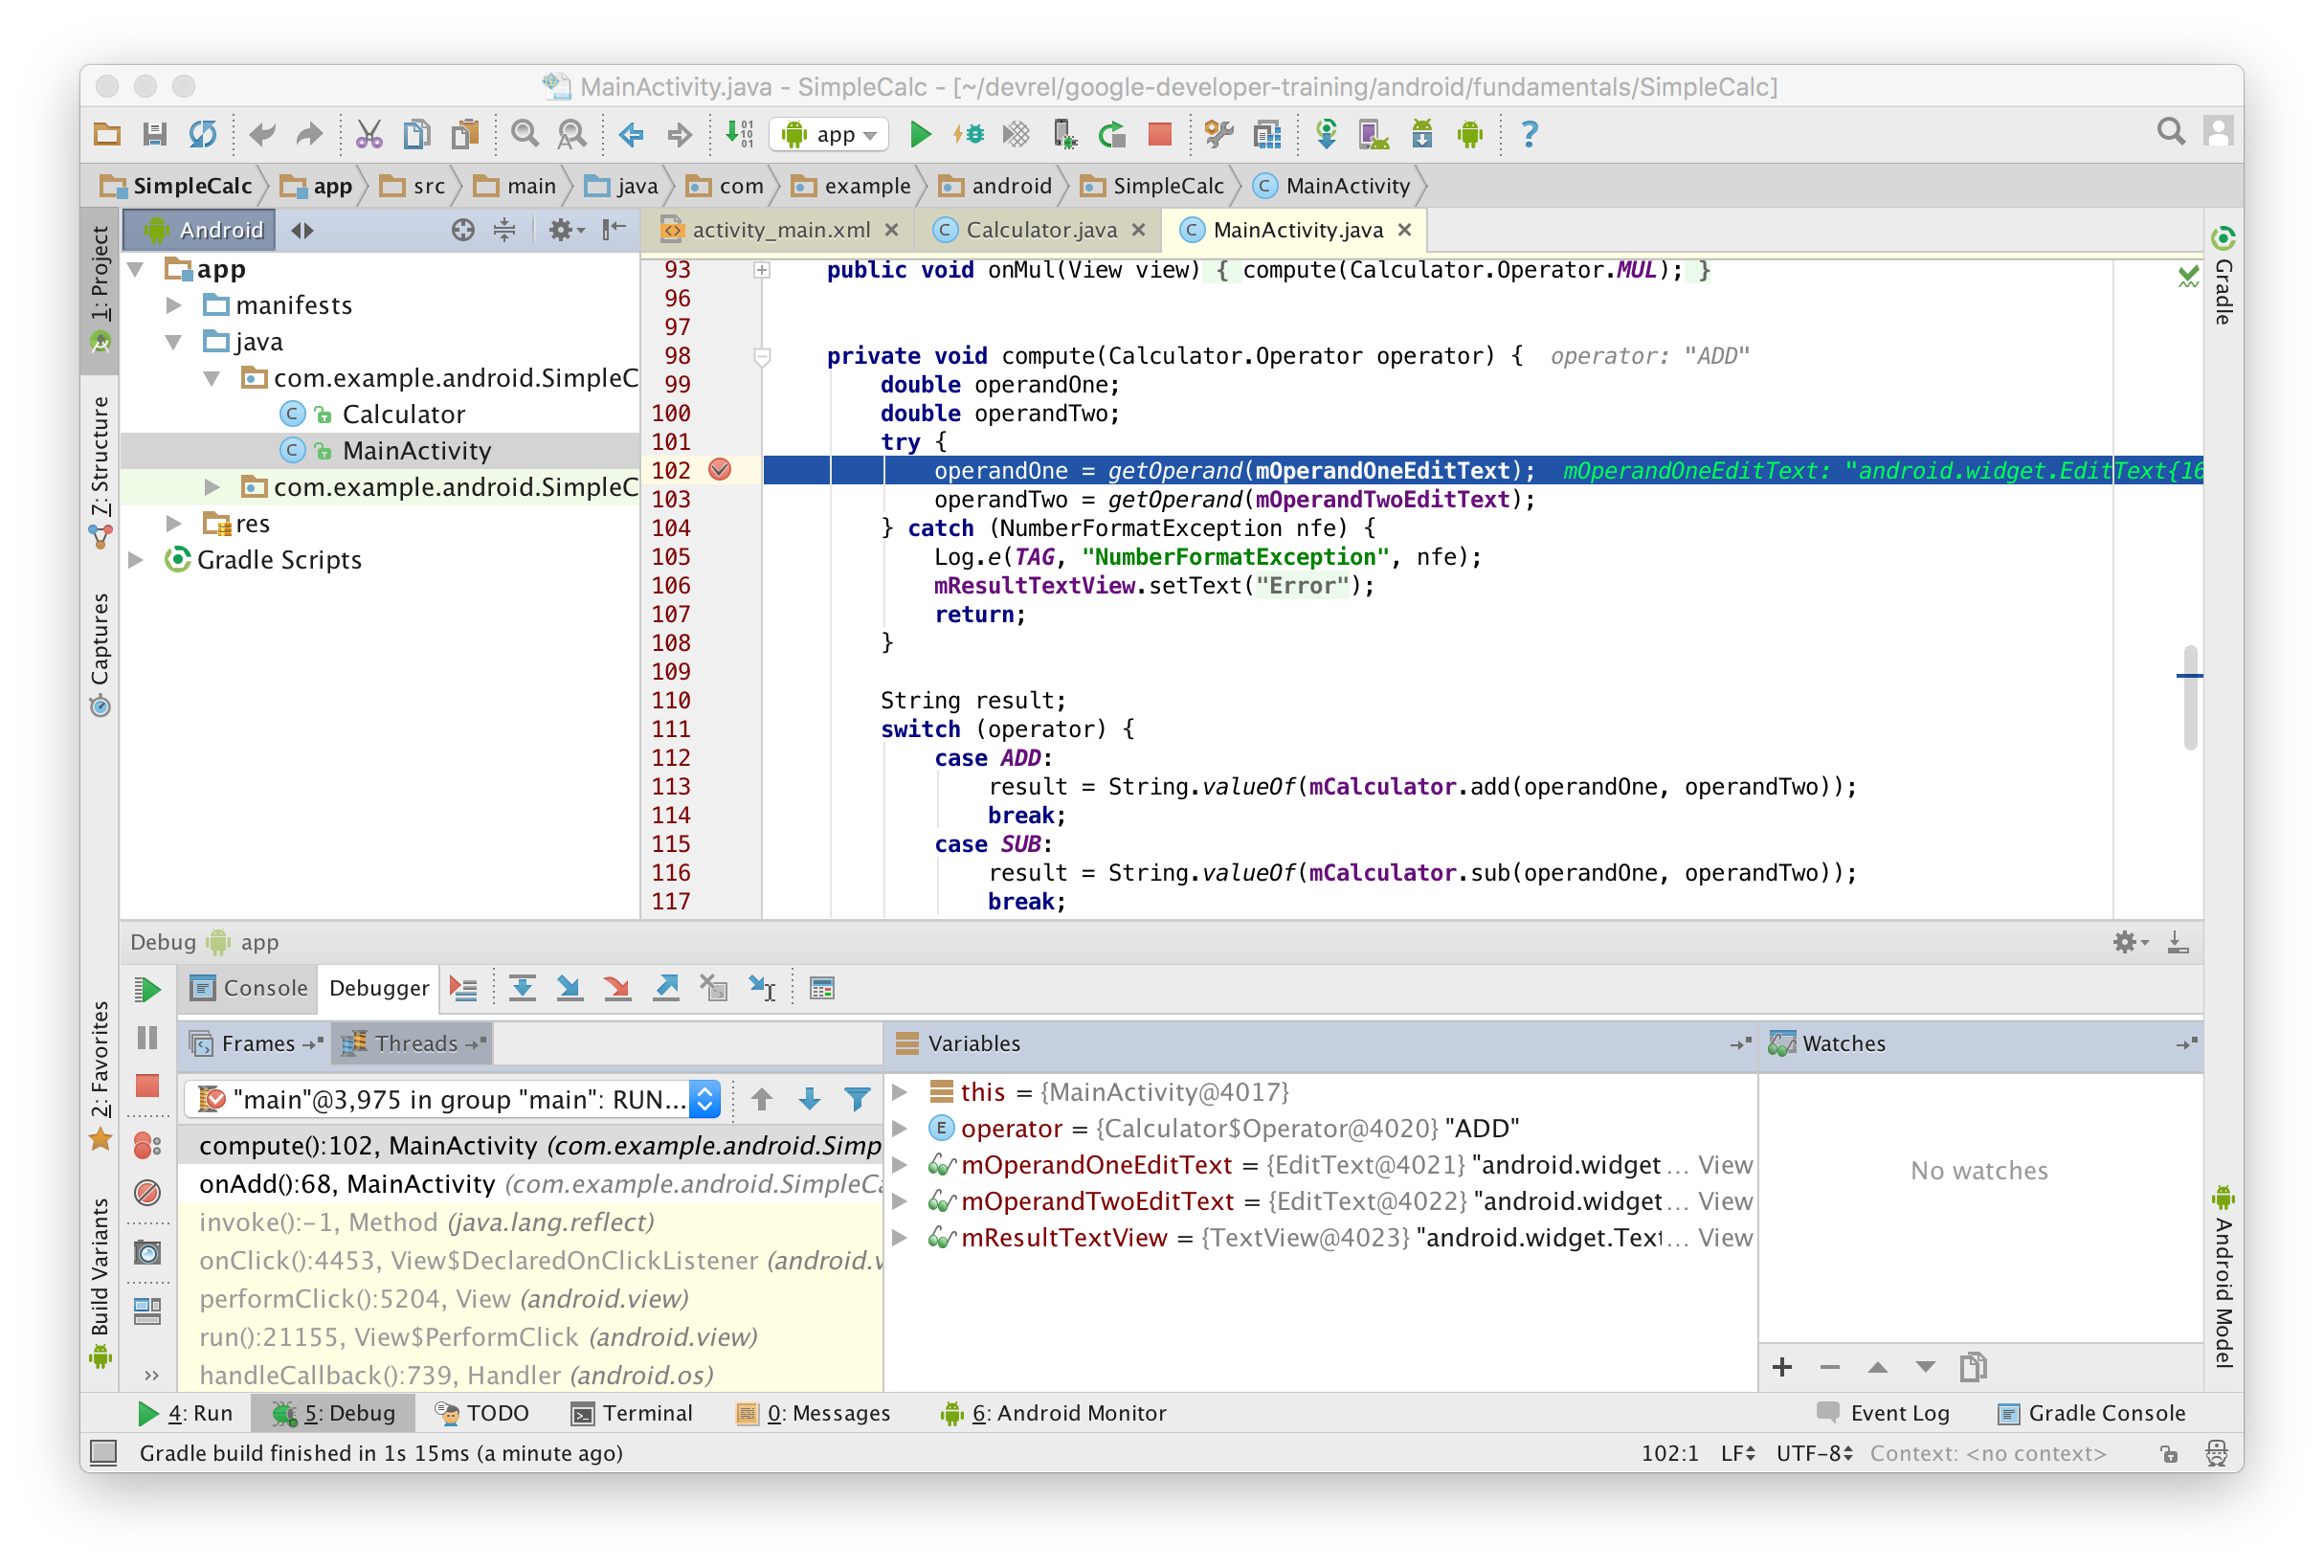
- Examine the the Debug window. It includes these parts:
- Frames panel: shows the current execution stack frames for a given thread. The execution stack shows each class and method that have been called in your app and in the Android runtime, with the most recent method at the top. Threads appear in a drop down menu. Your app is currently running in the main thread, and that the app is executing the compute() method in MainActivity.
- Variables panel: displays the variables in the current scope and their values. At this stage of your app's execution, the available variables are:
this(for the activity),operator(the operator name from Calculator.Operator that the method was called from), as well as the global variables for the EditTexts and the TextView. Each variable in this panel has a disclosure triangle to allow you to view the properties of the objects contained in those variables. Try expanding a variable to explore its properties. - Watches panel: displays the values for any variable watches you have set. Watches allow you to keep track of a specific variable in your program, and see how that variable changes as your program runs.
Resume your app's execution with Run > Resume Program or click the Resume
 icon on the left side of the debugger window.
The SimpleCalc app continues running, and you can interact with the app until the next time code execution arrives at the breakpoint.
2.2 Debug a running app
If your app is already running on a device or emulator, and you decide you want to debug that app, you can switch an already running app to debug mode.
- Run the SimpleCalc app normally, with the Run
 icon.
icon. - Select Run > Attach debugger to Android process or click the Attach
 icon in the toolbar.
 Select your app's process from the dialog that appears. Click OK.
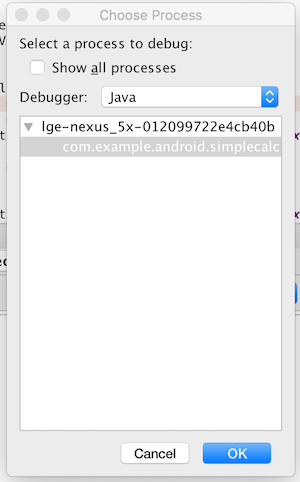
The Debug window appears, and you can now debug your app as if you had started it in debug mode.
Note: If the Debug window does not automatically appear, click the Debug tab at the bottom of the screen, and then the Debugger tab.
Task 3. Explore Debugger Features
In this task we'll explore the various features in the Android Studio debugger, including executing your app line by line, working with breakpoints, and examining variables.
3.1 Step through your app's execution
After a breakpoint, you can use the debugger to execute each line of code in your app one at a time, and examine the state of variables as the app runs.
- Debug your app in Android Studio, with the breakpoint you set in the last task.
In the app, enter numbers in both EditText views and click the Add button.
Your app's execution stops at the breakpoint that you set earlier, and the debugger shows the current state of the app. The current line is highlighted in your code.
Click the Step Over
 button at the top of the debugger window.
The debugger executes the current line in the compute() method (where the breakpoint is, the assignment for operandOne), and the highlight moves to the next line in the code (the assignment for operandTwo). The Variables panel updates to reflect the new execution state, and the current values of variables also appears after each line of your source code in italics.
You can also use Run > Step Over, or F8, to step over your code.
At the next line (the assignment for operandTwo), click the Step Into
 icon.
icon.Step Into jumps into the execution of a method call in the current line (versus just executing that method and remaining on the same line). In this case, because that assignment includes a call to getOperand(), the debugger scrolls the MainActivity code to that method definition.
When you step into a method, the Frames panel updates to indicate the new frame in the call stack (here, getOperand()), and the Variables panel shows the available variables in the new method scope. You can click any of the lines in the Frames panel to see the point in the previous stack frame where the method was invoked.
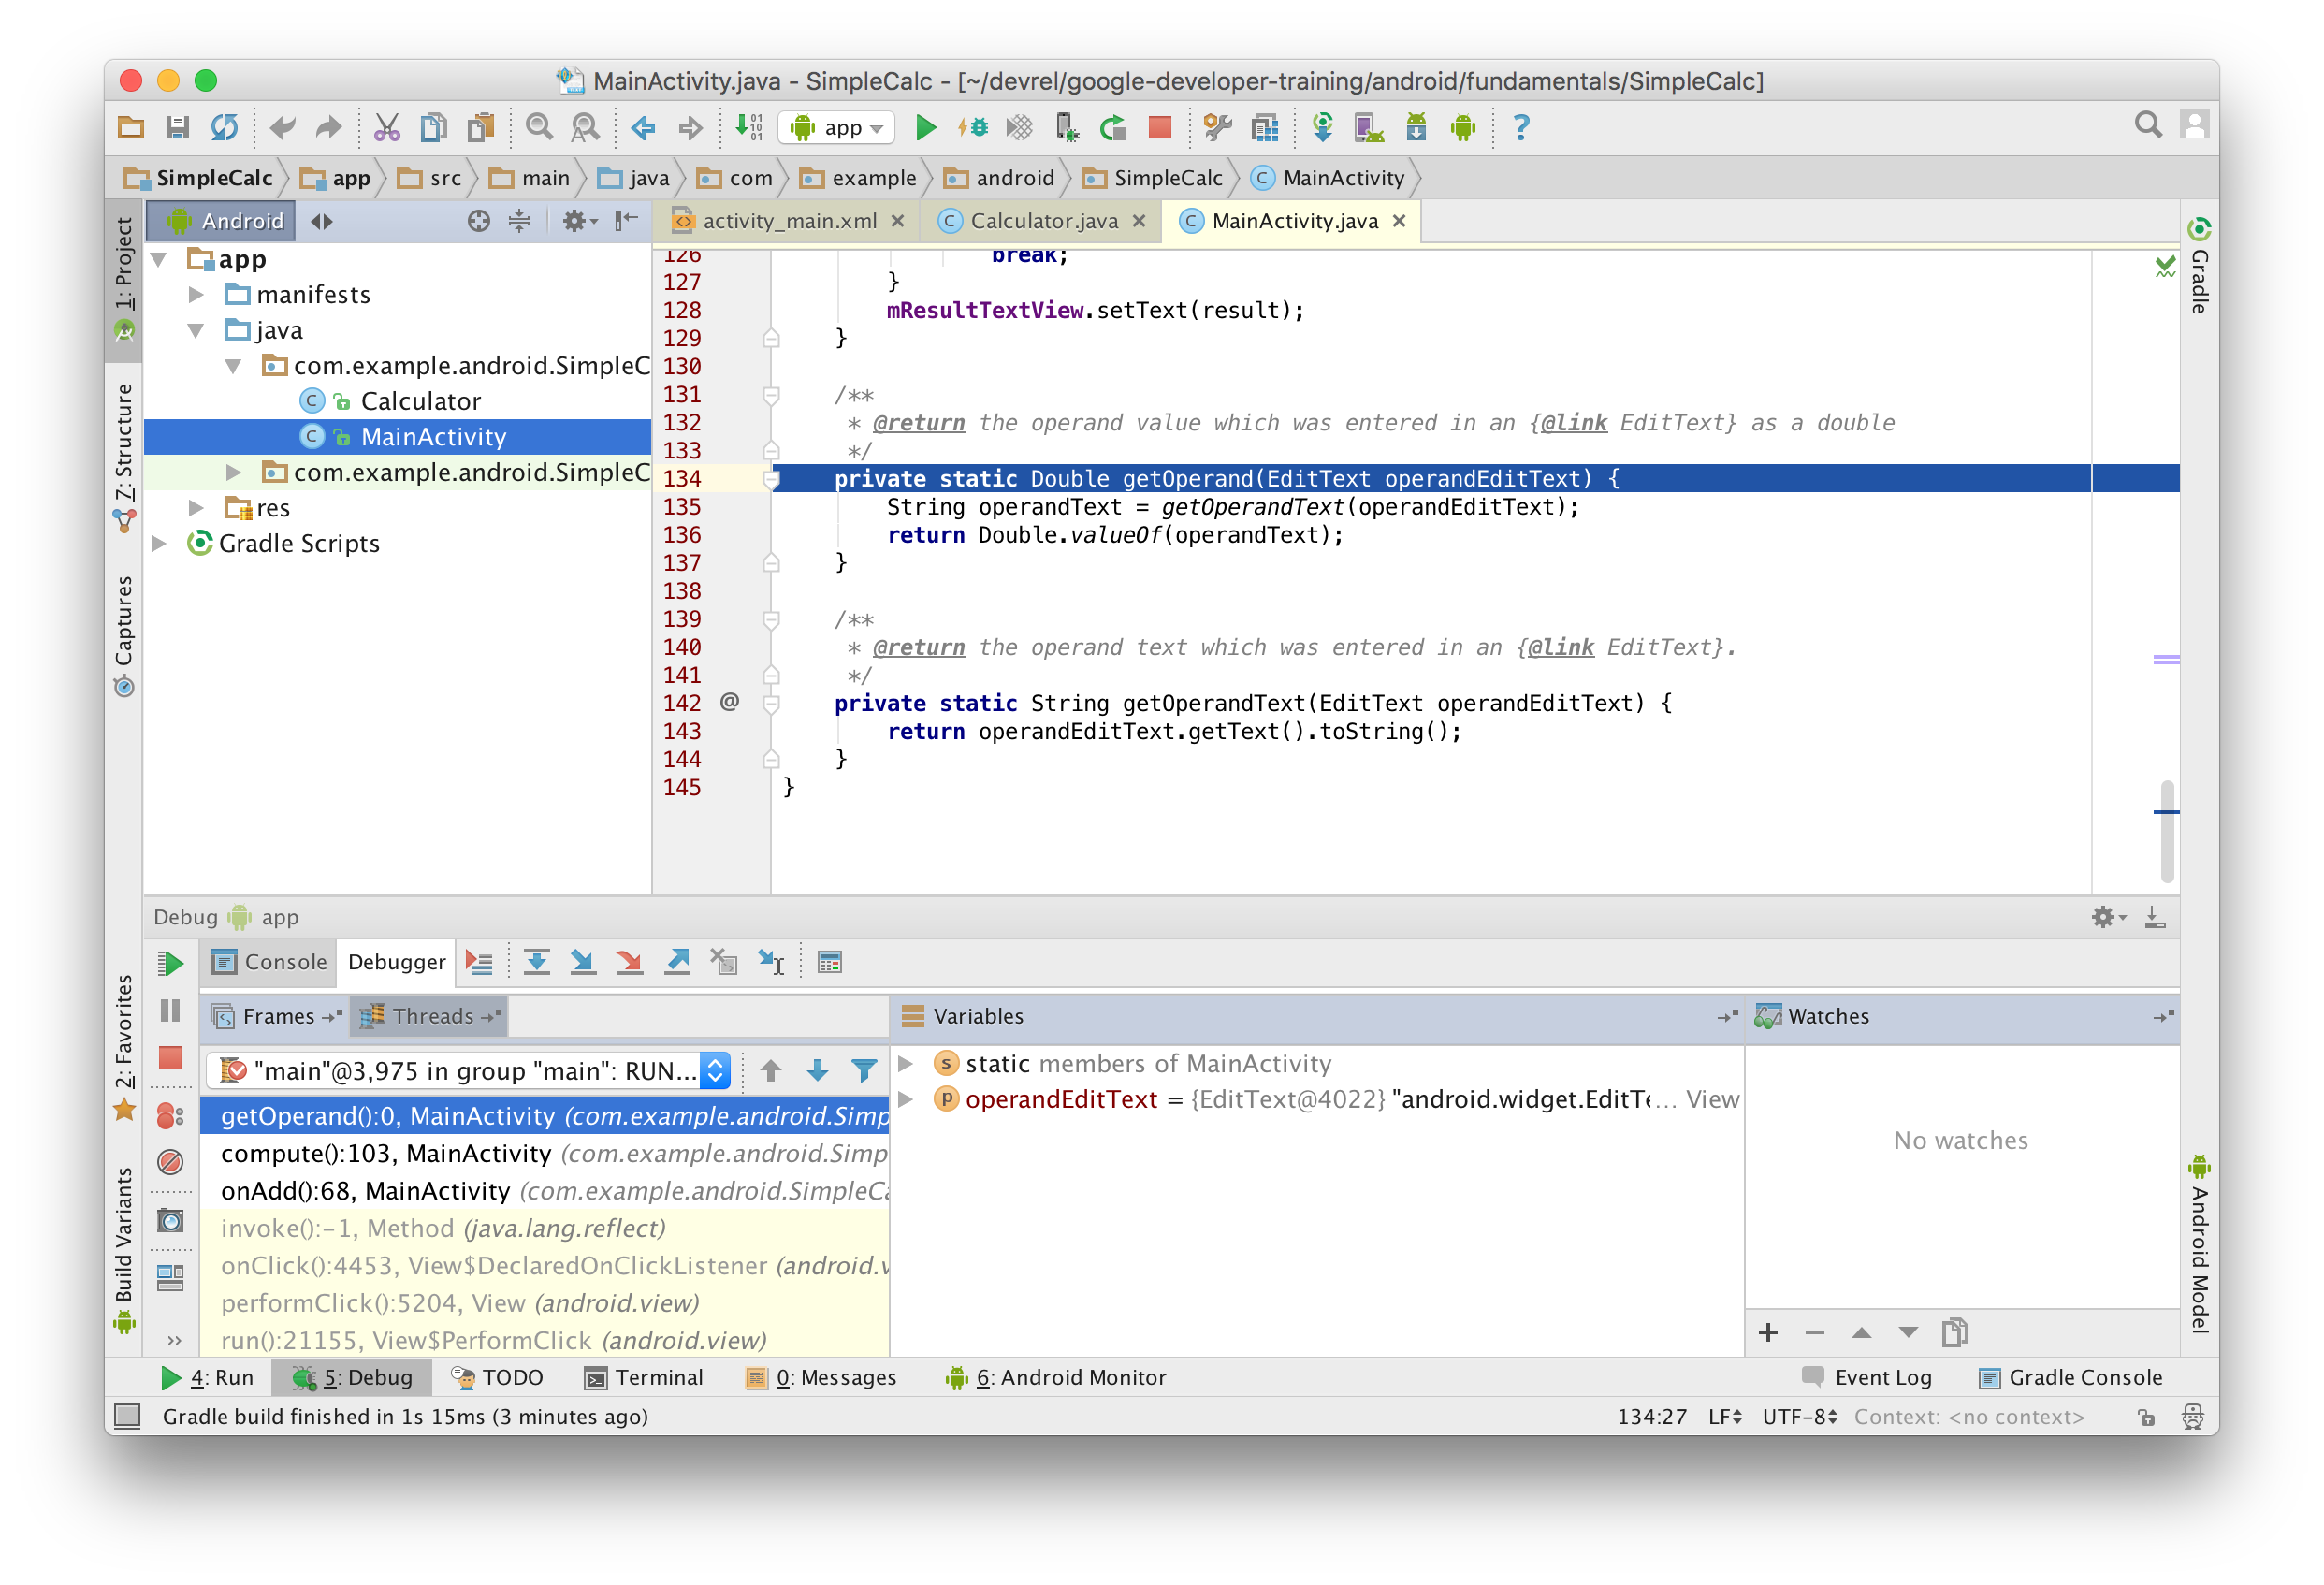
You can also use Run > Step Into, or F7, to step into a method.
- Click Step Over
 to run each of the lines in getOperand(). Note that when the method completes the debugger returns you to the point where you first stepped into the method, and all the panels update with the new information.
 - Use Step Over twice to move the execution point to the first line inside the case statement for ADD.
Click Step Into
 .
.The debugger executes the appropriate method defined in the Calculator class, opens the Calculator.java file, and scrolls to the execution point in that class. Again, the various panels update to reflect the new state.
Use the Step Out
 icon to execute the remainder of that calculation method and pop back out to the compute() method in MainActivity. You can then continue debugging the compute() method from where you left off.
You can also use Run > Step Out or Shift-F8 to step out of a method execution.
3.2 Work with Breakpoints
Use breakpoints to indicate where in your code you want to interrupt your app's execution to debug that portion of that app.
- Find the breakpoint you set in the last task at the start of the compute() method in MainActivity.
- Add a breakpoint to the start of the switch statement.
- Right-click on that new breakpoint and enter the following test in the Condition field:
(operandOne == 42)||(operandTwo == 42) Click Done.
This second breakpoint is a conditional breakpoint. The execution of your app will only stop at this breakpoint if the test in the condition is true. In this case, the expression is only true if one or the other operands you entered is 42. You can enter any Java expression as a condition as long as it returns a boolean.
- Run your app in debug mode (Run > Debug), or click Resume
 if it is already running. In the app, enter two numbers other than 42 and click the Add button. Execution halts at the first breakpoint in the compute() method.
 - Click Resume to continue debugging the app. Observe that execution did not stop at your second breakpoint, because the condition was not met.
Right click the first breakpoint and uncheck Enabled. Click Done. Observe that the breakpoint icon now has a green dot with a red border.
Disabling a breakpoint enables you to temporarily "mute" that breakpoint without actually removing it from your code. If you remove a breakpoint altogether you also lose any conditions you created for that breakpoint, so disabling it is often a better choice.
You can also mute all breakpoints in your app at once with the Mute Breakpoints
 icon.
icon.- In the app, enter 42 in the first EditText and click any button. Observe that the conditional breakpoint at the switch statement halts execution (the condition was met.)
Click the View Breakpoints
 icon on the left edge of the debugger window. The Breakpoints window appears.
The Breakpoints window enables you to view all the breakpoints in your app, enable or disable individual breakpoints, and add additional features of breakpoints including conditions, dependencies on other breakpoints, and logging.
- Click Done to close the breakpoints window.
3.3 Examine and modify variables
The Android Studio debugger lets you examine the state of the variables in your app as that app runs.
- Run the SimpleCalc app in debug mode if it is not already running.
In the app, enter two numbers, one of them 42, and click the Add button.
The first breakpoint in compute() is still muted. Execution stops at the second breakpoint (at the switch statement), and the debugger appears.
- Observe in the Variables panel that the operandOne and operandTwo variables have the values you entered into the app.
- Observe that the this variable is a MainActivity object. Click the disclosure arrow to view the member variables of that object.
- Right-click the operandOne variable in the Variables panel, and select Set Value. You can also use F2.
- Change the value of operandOne to 10 and press Return.
- Modify the value of operandTwo to 10 in the same way and press Return.
- Click the Resume icon to continue running your app. Observe that the result in the app is now 20, based on the variable values you changed in the debugger.
- In the app, click the Add button. Execution halts at the breakpoint.
Click the Evaluate Expression
 icon, or select Run > Evaluate Expression. The Evaluate Code Fragment window appears. You can also right-click on any variable and choose Evaluate Expression.
Use Evaluate Expression to explore the state of variables and objects in your app, including calling methods on those objects. You can enter any code into this window.
- Type mOperandOneEditText.getHint() into the Expression window and click Evaluate.
The Evaluate Expression window updates with the result of that expression. The hint for this EditText is the string "Type Operand 1", as was originally defined in the XML for that EditText.
The result you get from evaluating an expression is based on the app's current state. Depending on the values of the variables in your app at the time you evaluate expressions, you may get different results.
Note also that if you use Evaluate Expression to change the values of variables or object properties, you change the running state of the app.
- Click Close to hide the Evaluate Expression window.
Coding challenge
Challenge: In Task 1.3, you tried running the SimpleCalc app with no values in either of the EditText views, resulting in an error message. Use the debugger to step through the execution of the code and determine precisely why this error occurs. Fix the bug that causes this error.
Summary
- View logging information in Android Studio with the logcat tab of the Android Monitor pane.
- Run your app in debug mode by clicking the debug icon or choosing Run > Debug app.
- A breakpoint is a place in your code where you want to pause normal execution of your app to perform other actions. Set or clear a debugging breakpoint by clicking in the left gutter of the editor window immediately next to the target line
- The Debug window in Android Studio shows (stack) Frames, Variables in that frame and Watches (active tracking of a variable while the program runs).
Related concept
The related concept documentation is in Android Developer Fundamentals: Concepts.
Learn more
- Debug Your App (Android Studio User Guide)
- Debugging and Testing in Android Studio (video)
