3.1: The Android Studio debugger
Contents:
- About debugging
- Running the debugger
- Using breakpoints
- Stepping through code
- Viewing execution stack frames
- Inspecting and modifying variables
- Setting watches
- Evaluating expressions
- More tools for debugging
- Trace logging and the Android manifest
- Related practical
- Learn more
In this chapter you'll learn about debugging your apps in Android Studio.
About debugging
Debugging is the process of finding and fixing errors (bugs) or unexpected behavior in your code. All code has bugs, from incorrect behavior in your app, to behavior that excessively consumes memory or network resources, to actual app freezing or crashing.
Bugs can result for many reasons:
- Errors in your design or implementation
- Android framework limitations (or bugs)
- Missing requirements or assumptions for how the app should work
- Device limitations (or bugs)
Use the debugging, testing, and profiling capabilities in Android Studio to help you reproduce, find, and resolve all of these problems. Those capabilities include:
- The Logcat pane for log messages
- The Debugger pane for viewing frames, threads, and variables
- Debug mode for running apps with breakpoints
- Test frameworks such as JUnit or Espresso
- Dalvik Debug Monitor Server (DDMS), to track resource usage
In this chapter you learn how to debug your app with the Android Studio debugger, set and view breakpoints, step through your code, and examine variables.
Running the debugger
Running an app in debug mode is similar to running the app. You can either run an app in debug mode, or attach the debugger to an already-running app.
Run your app in debug mode
To start debugging, click
 Debug in the toolbar. Android Studio builds an APK, signs it with a debug key, installs it on your selected device, then runs it and opens the Debug pane with the Debugger and Console tabs.

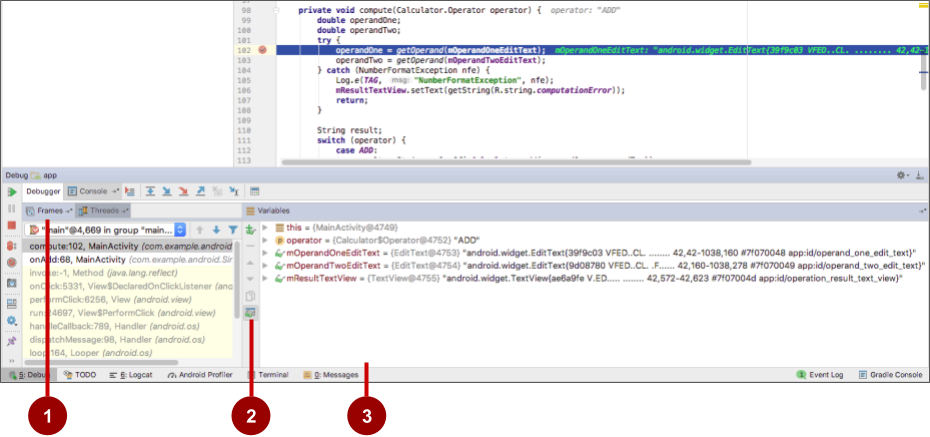
The figure above shows the Debug pane with the Debugger and Console tabs. The Debugger tab is selected, showing the Debugger pane with the following features:
Frames tab: Click to show the Frames pane with the current execution stack frames for a given thread. The execution stack shows each class and method that have been called in your app and in the Android runtime, with the most recent method at the top.
Click the Threads tab to replace the Frames pane with the Threads pane.
Watches button: Click to show the Watches pane within the Variables pane, which shows the values for any variable watches you have set. Watches allow you to keep track of a specific variable in your program, and see how that variable changes as your program runs.
- Variables pane: Shows the variables in the current scope and their values. Each variable in this pane has an expand icon to expand the list of object properties for the variable. Try expanding a variable to explore its properties.
Debug a running app
If your app is already running on a device or emulator, start debugging that app with these steps:
- Select Run > Attach debugger to Android process or click the
 Attach icon in the toolbar.
 In the Choose Process dialog, select the process to which you want to attach the debugger.
By default, the debugger shows the device and app process for the current project, as well as any connected hardware devices or virtual devices on your computer. Check the Show all processes option to show all processes on all devices.
Click OK. The Debug pane appears as before.
Resume or stop debugging
To resume executing an app after debugging it, select Run > Resume Program or click the Resume
 icon.
icon.
To stop debugging your app, select Run > Stop or click the Stop icon
 in the toolbar.
Using breakpoints
Android Studio supports several types of breakpoints that trigger different debugging actions. The most common type is a breakpoint that pauses the execution of your app at a specified line of code. While paused, you can examine variables, evaluate expressions, then continue execution line by line to determine the causes of runtime errors.
You can set a breakpoint on any executable line of code.
Add breakpoints
To add a breakpoint to a line in your code, use these steps:
- Locate the line of code where you want to pause execution.
Click in the left gutter of the editor pane at that line, next to the line numbers. A red dot appears at that line, indicating a breakpoint. The red dot includes a check mark if the app is already running in debug mode.
As an alternative, you can choose Run > Toggle Line Breakpoint or press Control-F8 (Command-F8 on a Mac) to set or clear a breakpoint at a line.

If your app is already running, you don't need to update it to add the breakpoint.
If you click a breakpoint by mistake, you can undo it by clicking the breakpoint. If you clicked a line of code that is not executable, the red dot includes an "x" and a warning appears that the line of code is not executable.
When your code execution reaches the breakpoint, Android Studio pauses execution of your app. You can then use the tools in the Debug pane to view the state of the app and debug that app as it runs.
View and configure breakpoints
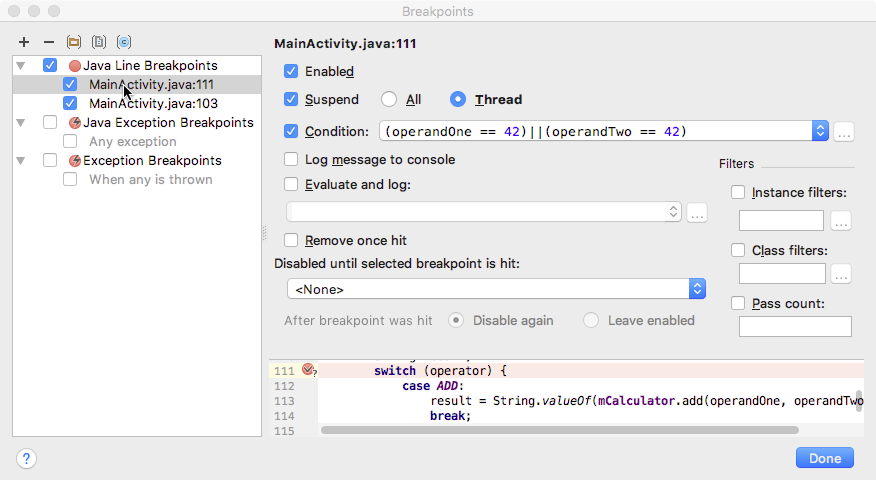
To view all the breakpoints you've set and configure breakpoint settings, click the View Breakpoints icon
 on the left edge of the Debug pane. The Breakpoints window appears.

In this window all the breakpoints you have set appear in the left pane, and you can enable or disable each breakpoint with the checkboxes. If a breakpoint is disabled, Android Studio does not pause your app when execution reaches that breakpoint.
Select a breakpoint from the list to configure its settings. You can configure a breakpoint to be disabled at first and have the system enable it after a different breakpoint is encountered. You can also configure whether a breakpoint should be disabled after it has been reached.
To set a breakpoint for any exception, select Exception Breakpoints in the list of breakpoints.
Disable (mute) all breakpoints
Disabling a breakpoint enables you to temporarily "mute" that breakpoint without removing it from your code. If you remove a breakpoint altogether you also lose any conditions or other features you created for that breakpoint, so disabling it can be a better choice.
To mute all breakpoints, click the Mute Breakpoints icon
 . Click the icon again to enable (unmute) all breakpoints.
Use conditional breakpoints
Conditional breakpoints are breakpoints that only stop execution of your app if the test in the condition is true. To define a test for a conditional breakpoint, use these steps:
Right-click (or Control-click) a breakpoint, and enter a test in the Condition field.

The test you enter in this field can be any Java expression as long as it returns a boolean value. You can use variable names from your app as part of the expression.
You can also use the Breakpoints window to enter a breakpoint condition.
Run your app in debug mode. Execution of your app stops at the conditional breakpoint, if the condition evaluates to true.
Stepping through code
After your app's execution has stopped because a breakpoint has been reached, you can execute your code from that point one line at a time with the Step Over, Step Into, and Step Out functions.
To use any of the step functions:
Begin debugging your app. Pause the execution of your app with a breakpoint.
Your app's execution stops, and the Debugger pane shows the current state of the app. The current line is highlighted in your code.
Click the Step Over icon
 , select Run > Step Over, or press F8. Step Over executes the next line of the code in the current class and method, executing all of the method calls on that line and remaining in the same file.
- Click the Step Into icon
 , select Run > Step Into, or press F7. Step Into jumps into the execution of a method call on the current line (as compared to just executing that method and remaining on the same line). The Frames pane (which you'll learn about in the next section) updates to show the new stack frame (the new method). If the method call is contained in another class, the file for that class is opened and the current line in that file is highlighted. You can continue stepping over lines in this new method call, or step deeper into other methods.
 - Click the Step Out icon
 , select Run > Step Out, or press Shift-F8. Step Out finishes executing the current method and returns to the point where that method was called.
 - To resume normal execution of the app, select Run > Resume Program or click the Resume
 icon.
icon.
Viewing execution stack frames
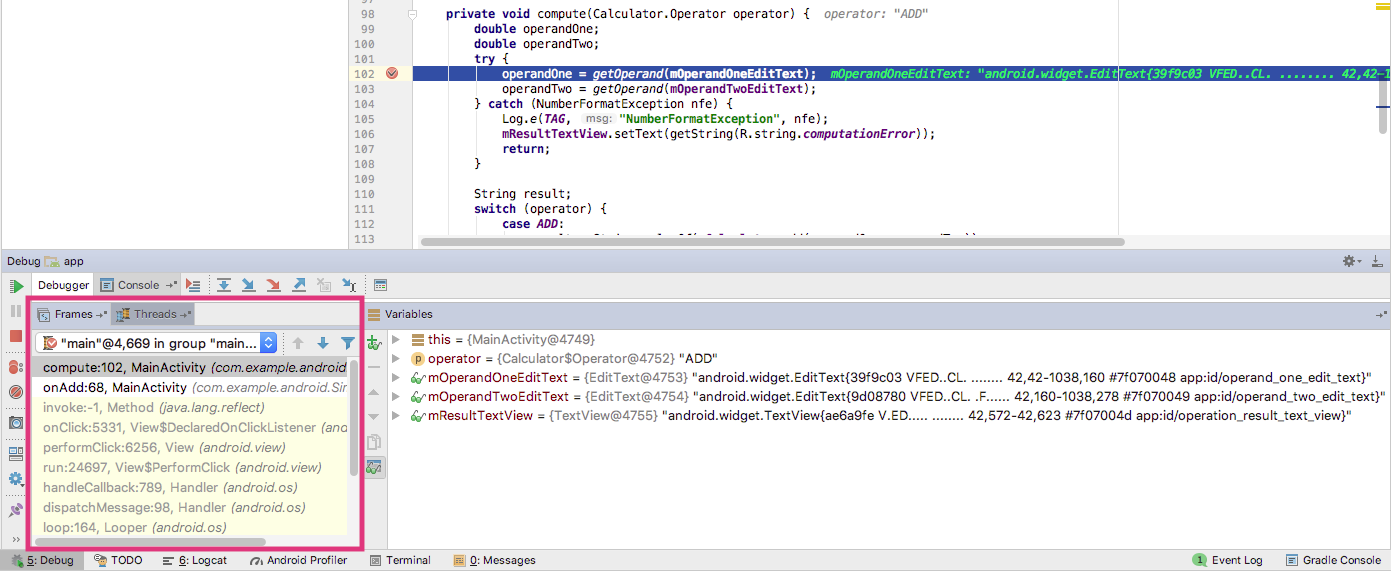
The Frames pane of the Debug pane allows you to inspect the execution stack and the specific frame that caused the current breakpoint to be reached.

The execution stack shows all the classes and methods (frames) that are being executed up to this point in the app, in reverse order (most recent frame first). As execution of a particular frame finishes, that frame is popped from the stack and execution returns to the next frame.
Clicking a line for a frame in the Frames pane opens the associated source in the editor and highlights the line where that frame was initially executed. The Variables and Watches panes also update to reflect the state of the execution environment when that frame was last entered.
Inspecting and modifying variables
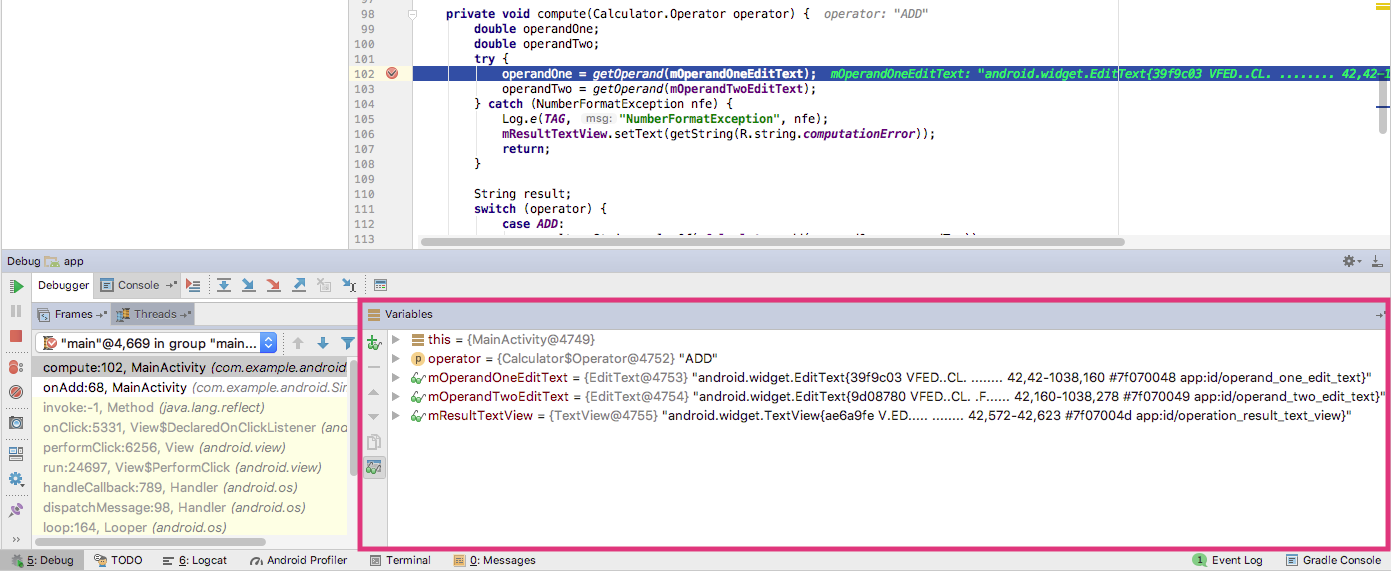
The Variables pane of the Debugger pane allows you to inspect the variables available at the current stack frame when the system stops your app on a breakpoint. Variables that hold objects or collections such as arrays can be expanded to view their components.
The Variables pane also allows you to evaluate expressions on the fly using static methods or variables available within the selected frame.
If the Variables pane is not visible, click the Restore Variables View icon
 .
.

To modify variables in your app as it runs:
- Right-click (or Control-click) any variable in the Variables pane, and select Set Value. You can also press F2.
Enter a new value for the variable, and press Return.
The value you enter must be of the appropriate type for that variable, or Android Studio returns a "type mismatch" error.
Setting watches
The Watches pane provides similar functionality to the Variables pane except that expressions added to the Watches pane persist between debugging sessions. Add watches for variables and fields that you access frequently or that provide state that is helpful for the current debugging session.
To use watches:
- Begin debugging your app.
- Click the Show Watches icon
 . The Watches pane appears next to the Variables pane.
 - In the Watches pane, click the plus (+) button. In the text box that appears, type the name of the variable or expression you want to watch and then press Enter.
Remove an item from the Watches list by selecting the item and then clicking the minus (–) button.
Change the order of the elements in the Watches pane list by selecting an item and then clicking the up or down icons.
Evaluating expressions
Use Evaluate Expression to explore the state of variables and objects in your app, including calling methods on those objects. To evaluate an expression:
Click the Evaluate Expression icon
 , or select Run > Evaluate Expression.
The Evaluate Code Fragment window appears. You can also right-click on any variable and choose Evaluate Expression.
Enter any Java expression into the top field of the Evaluate Code Fragment window, and click Evaluate.
The Result field shows the result of that expression. Note that the result you get from evaluating an expression is based on the app's current state. Depending on the values of the variables in your app at the time you evaluate expressions, you may get different results. Changing the values of variables in your expressions also changes the current running state of the app.
More tools for debugging
Android Studio and the Android SDK include a number of other tools to help you find and correct issues in your code.
System log (Logcat pane)
As you've learned in another chapter, you can use the Log class to send messages to the Android system log, and view those messages in Android Studio in the Logcat pane.
To write log messages in your code, use the Log class. Log messages help you understand the execution flow by collecting the system debug output while you interact with your app. Log messages can tell you what part of your app failed. For more information about logging, see Reading and Writing Logs.
Tracing and logging
Analyzing traces allows you to see how much time is spent in certain methods, and which ones are taking the longest times.
To create the trace files, include the Debug class and call one of the startMethodTracing() methods. In the call, you specify a base name for the trace files that the system generates.
To stop tracing, call stopMethodTracing(). These methods start and stop method tracing across the entire virtual machine. For example, you could call startMethodTracing() in the onCreate() method of your Activity, and call stopMethodTracing() in the onDestroy() method of that Activity.
Other tools
- The Android Debug Bridge (ADB) is a command-line tool that lets you communicate with an emulator instance or connected Android-powered device.
- The Android Profiler provides real-time data for your app's CPU, memory, and network activity. You can perform sample-based method tracing to time your code execution, capture heap dumps, view memory allocations, and inspect the details of network-transmitted files.
- The CPU Profiler helps you inspect your app's CPU usage and thread activity in real-time, and record method traces, so you can optimize and debug your app's code.
- The Network Profiler displays real-time network activity on a timeline, showing data sent and received, as well as the current number of connections. This lets you examine how and when your app transfers data, and optimize the underlying code appropriately.
Trace logging and the AndroidManifest.xml file
There are multiple types of debugging available to you beyond setting breakpoints and stepping through code. You can also use logging and tracing to find issues with your code. When you have a trace log file (generated by adding tracing code to your app), you can load the log files in Traceview, which displays the log data in two panes:
- A timeline pane describes when each thread and method started and stopped.
- A profile pane provides a summary of what happened inside a method.
Likewise, to make the app debuggable even when the app is running on a device in user mode, you can set android:debuggable in the <application> tag of the AndroidManifest.xml file to "true". By default, the debuggable value is set to "false".
You can create and configure build types in the module-level build.gradle file inside the android {} block. When you create a new module, Android Studio creates the debug and release build types for you. Although the debug build type doesn't appear in the build configuration file, Android Studio configures it with debuggable true. This allows you to debug the app on secure Android-powered devices and configures APK signing with a generic debug keystore. If you want to add or change certain settings, add the debug build type to your configuration.
When you prepare your app for release, you must remove all the extra code in your source files that you wrote for testing purposes.
In addition to prepping the code itself, there are a few other tasks you need to complete in order to get your app ready to publish. These include:
- Removing logging statements.
- Remove any calls to show
Toastmessages. - Disable debugging in the
AndroidManifest.xmlfile by either removingandroid:debuggableattribute from the<application>tag, or settingandroid:debuggableto"false". - Remove all debug tracing calls from your source code files such as
startMethodTracing()andstopMethodTracing().
All these changes made for debugging must be removed from your code before release because they can impact the execution and performance production code.
Related practical
The related practical is 3.1: The debugger.
Learn more
Android Studio documentation:
- Android Studio User Guide
- Debug Your App
- Write and View Logs
- Analyze a Stack Trace
- Android Debug Bridge
- Android Profiler
- Network Profiler
- CPU Profiler
- Traceview
- Create and Edit Run/Debug Configurations
Other: