4.0: Performance
Contents:
- What is good performance?
- Why 16 milliseconds per frame?
- A basic performance test
- Checking your frame rate
- Approaching performance problems
- Keeping your app responsive
- Monitoring the performance of your running app
- Learn more
As an Android developer, you are also an Android user, and you know what it feels like when an app doesn't load, takes a long time to load, stutters at every animation, crashes randomly, and on top of that, drains the battery, or uses up your whole data plan.
Users give higher ratings to apps that respond quickly to user input, perform smoothly and consistently, and respect mobile's limited battery resources.
To make a useful, interesting, and beautiful app stand out from the crowd, you should also make it as small, fast, and efficient as possible. Consider the impact your app might have on the device's battery, memory, and device storage, and be considerate of users' data plans when fetching and storing data on the Internet.
As with other bugs and design problems you may have with your app, it may be easy or hard to discover what is causing your app to perform below your expectations. The following two approaches combined have proven useful for tracking down, fixing, and testing for performance problems:
- Use tools to inspect your app and acquire performance data measurements.
- Use a systematic, iterative approach, so that you can measure improvements resulting from your changes to the app.
While much more comprehensive than the performance section in the Android Developer Fundamentals course, this chapter and its associated practicals are only starting points to get you on track to become a performance expert.
What is good performance?
App performance. What happens on the screen is the user's most immediate experience of your app. Your app must consistently draw the screen fast enough for your users to see smooth, fluid motions, transitions, and responses. To accomplish this, your app has to do all its work in 16 milliseconds or less for every screen refresh.
Respecting the user. When it comes to respecting the user's resources, it's about minimizing the use of mobile data and battery power. Users will uninstall apps that drain the battery.
Balance. Maximizing performance is all about balance. To give users the best possible experience, you want to find and make the best trade-offs between app complexity, functionality, and visuals.
Why 16 milliseconds per frame?
Human eyes and 16 ms per refresh
The human brain receives and processes visual information continuously. For example, when still images are displayed in sequence fast enough, people perceive them as motion, such as in the flip book shown below.

A flip book moves at around 10-12 pages per second. For movies, 24-30 images per second is enough, but still unconvincing without fancy cinematic effects. An ideal number is 60 images per second, as most people see this as high-quality, smooth motion.
This measurement is called "frame rate" or "frames per second" (FPS).
Computer hardware and 60 frames per second == 16 ms per frame
The human eye is very discerning when it comes to motion inconsistencies. For example, if your app is running on average at 60 frames per second, and just one frame takes much longer than the preceding ones to display, users will notice a break in smoothness that is generally called "hitching," "lag," "stutter," or "jank."
Most modern mobile devices refresh their displays at 60 frames per second. This number is dictated by a device's hardware, which defines how many times per second the screen can update.
To match the hardware screen's 60 updates per second, the system software attempts to redraw your current app activity every 16 ms (1000 ms / 60 frames = 16.666 ms/frame).
That's 16 ms total. Along with drawing the UI, the system has to take time to respond to intents, handle input events, and so on. Your app shares these 16 ms with a lot of other subsystems on Android, so 16 ms/frame is an upper bound.
In the diagram below:
- Each frame takes 16 ms or less to present.
- If your app takes too long and does not finish the update in 16 ms,
- ... you get what is called a "dropped frame," "delayed frame," or "jank," which users see as a stutter.

As an app developer, you want your app to consistently use less than 16 ms per frame throughout your user's experience.
For more on this topic, see the Why 60 fps video.
A basic performance test
What follows is the most basic performance test for your app . It requires no special setup or tools, just your app, you, and honest observation.
- Install your app on the lowest-end device that your target audience might have. This is very important. For example, if you built an app for mapping clean water wells in rural areas, your primary audience may not have the latest high-end devices.
- Use your app as a user would, for as long as a typical user might. Keep detailed notes on even the smallest wait, stutter, or unresponsiveness. Watch out for increasing slowness over time.
- Try to crash your app by tapping fast and randomly, even interacting in ways you would not want your users to use the app.
- Hand the device to a friend and take notes as you watch them use it. Before they start, ask them about their expectations, then listen to their comments during use and get additional feedback when they are done. You will likely get feedback not just on performance, but also on UI efficiency.
- Optionally, to get feedback from a larger audience, run a mini-usability test as demonstrated in the Usability Cafe video.
netdelay parameter).
If these hands-on tests don't reveal any performance problems, you are off to a great start.
If you do gather any notes related to performance, then performance is a problem for your app, and you must figure out the underlying causes and fix them.
Checking your frame rate
You can check how well your app does at rendering screens within the 16 ms/frame limit by using the Profile GPU Rendering tool on your Android device. You must have Developer Options turned on to use this tool.
- Go to Settings >Developer options.
- Scroll down to the Monitoring section.
- Select Profile GPU rendering.
- Choose On screen as bars in the dialog box. Immediately you will start seeing colored bars on your screen, similar to the ones in the screenshot below.
Return to your app.
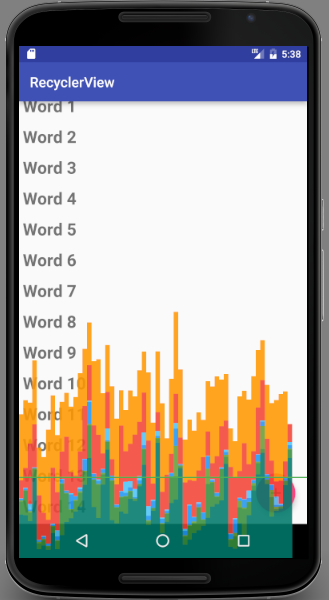
One bar represents one frame of rendering. The taller the bar, the longer the frame took to render.
- The colors in each bar represent the different stages in rendering the screen.
- If a bar goes above the green line, it took more than 16 ms to render. Ideally, most of the bars stay below the green line most of the time, but when you are loading an image for the first time, the bar may go significantly higher. Users may not perceive this as a problem, because they may expect to have to wait a moment for an image to load for the first time.
Below is an image of just bars for a device that is running Android 6.0 or higher. (The bars for older Android versions use different coloring. See Profile GPU Rendering Walkthrough for the color legend for older versions.)
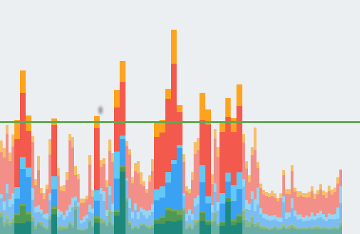

For example, if the green Input portion of the bar is tall, your app spends a lot of time handling input events. Read more about what the different stages mean in Analyzing with Profile GPU Rendering. See the Profile GPU Rendering Walkthrough for a tutorial, and see the Profile GPU Rendering practical for details on how to use this tool to check and improve your app's performance.
Approaching performance problems
Use performance profiling tools
Android and Android Studio come with many performance profiling tools to help you identify performance problems and track down where they are in your code. For example:
- Test how fast the screen renders and where in the rendering pipeline your app may be doing too much work by using the Profile GPU Rendering tool described above.
- Visualize your app's view hierarchy by using the Layout Inspector (Tools > Android > Layout Inspector). Look for ways to improve view layout performance.
- Use
Batterystatsand Battery Historian to chart battery usage over time. Monitor battery level and charging state in your app using the BatteryManager class.
In Android Studio 3.0 and higher, you can use the Android Profiler tool:
- Use the CPU Profiler to monitor CPU usage over time.
- Find memory leaks and observe your app allocations with with the Memory Profiler.
- Monitor the frequency of data transfers with the Network Profiler, and identify where you might be able to transfer data less frequently or in larger chunks.
See Performance Profiling Tools for a comprehensive list and documentation.
Follow the Performance Improvement Lifecycle
Use a systematic iterative approach to finding and fixing performance problems. This helps you track what you are testing, the data you gather, the fixes you implement, and your app's improvement over time. The performance tuning lifecycle is a three-step, repeatable way to tune your app's performance.
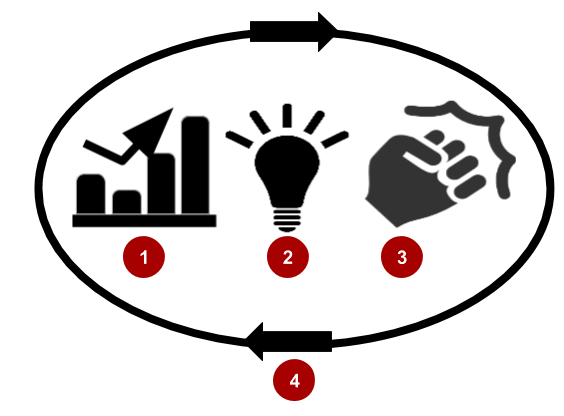
The Performance Improvement Lifecycle consists of three repeated phases:
1.
![]() Gather information. Use the performance profiling tools described in Approaching performance problems, above, to capture data about your app. Record that data so that later, you can compare it to data you capture after you make changes to your app.
Gather information. Use the performance profiling tools described in Approaching performance problems, above, to capture data about your app. Record that data so that later, you can compare it to data you capture after you make changes to your app.
2.
![]() Gain insight. Take the time to understand what your gathered data means for your app. You may need to go through several iterations of gathering information with multiple tools to pinpoint what the problems are. For example, you may have a complex view hierarchy, but it renders fast, and the big problem is that your app is doing work on the UI thread that should be done on a background thread instead.
Gain insight. Take the time to understand what your gathered data means for your app. You may need to go through several iterations of gathering information with multiple tools to pinpoint what the problems are. For example, you may have a complex view hierarchy, but it renders fast, and the big problem is that your app is doing work on the UI thread that should be done on a background thread instead.
3.
![]() Take action. Evaluate ways to solve your problem. Taking action can take different forms, and what you decide to do depends on your situation and context. You may change the code and optimize layouts, or your backend. What you change may be affected by constraints such as coding resources, budgets, and deadlines.
Take action. Evaluate ways to solve your problem. Taking action can take different forms, and what you decide to do depends on your situation and context. You may change the code and optimize layouts, or your backend. What you change may be affected by constraints such as coding resources, budgets, and deadlines.
4.
![]() Verify. Check to make sure that your changes had the desired outcome:
Verify. Check to make sure that your changes had the desired outcome:
- Gather a second set of data. Run the tools again to measure the impact of your changes.
- Compare it to your original data to make sure you've fixed the right problem, and to find out whether you need to look for additional performance improvements to make.
- Make different or additional changes.
Repeat this process on all target devices until your app consistently responds smoothly to all user actions, never stutters, and never makes the user wait.
For a more on the Performance Improvement Cycle, watch Tools not Rules and The Performance Lifecycle.
Keeping your app responsive
It's possible to write code that wins every performance contest in the world but still feels sluggish, hangs, freezes for significant periods, or takes too long to process input. The worst thing that can happen to your app's responsiveness is an "Application Not Responding" (ANR) dialog like the one shown below. At this point, your app has been unresponsive for a considerable period of time, so the system offers the user an option to quit the app. The system displays an "Application Not Responding" (ANR) dialog when an app is unresponsive.
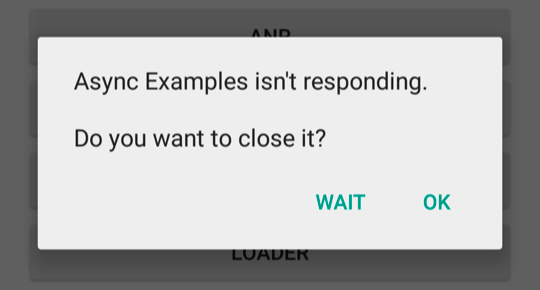
Android displays an ANR dialog when it detects one of the following conditions:
Your app doesn't respond within 5 seconds to an input event such as a key press or screen tap. This can happen if your app performs too much work on the UI thread, in particular in
onCreate().Examine your code. If any work is not required to complete before the app can proceed, move it off the UI thread, for example using a
Loaderor anAsyncTask. Show the user that progress is being made, for example with a progress bar in your UI.A
BroadcastReceiverhasn't finished executing within 10 seconds.To prevent ANRs from happening for this reason, use broadcast receivers only for their intended purpose. Broadcast receivers are meant to do small, discrete amounts of work in the background, such as saving a setting or registering a notification.
It's critical to design responsiveness into your application so the system never displays an ANR dialog to the user. Use performance tools such as Systrace and Traceview to determine bottlenecks in your app's responsiveness. See the practicals for introductions to performance tools.
See Keeping Your App Responsive for more details.
Monitoring the performance of your running app
Android Studio has tools to measure your app's memory usage, CPU, and network performance. The advanced profiling tools display realtime data updates for CPU, memory, and network activity.
To use the Android Profiler tool (available in Android Studio 3.0 and higher):
- In Android Studio, at the bottom of the window, click the Android Profiler tab.
- Run your app and interact with it. The monitors update to reflect the app's use of resources. Note that to get accurate data, you should do this on a physical, not virtual, device.
The default view in the Android Profiler window, as shown below, displays a simplified set of data for each profiler. When you click on a tool, it opens to show a more details with more functionality.
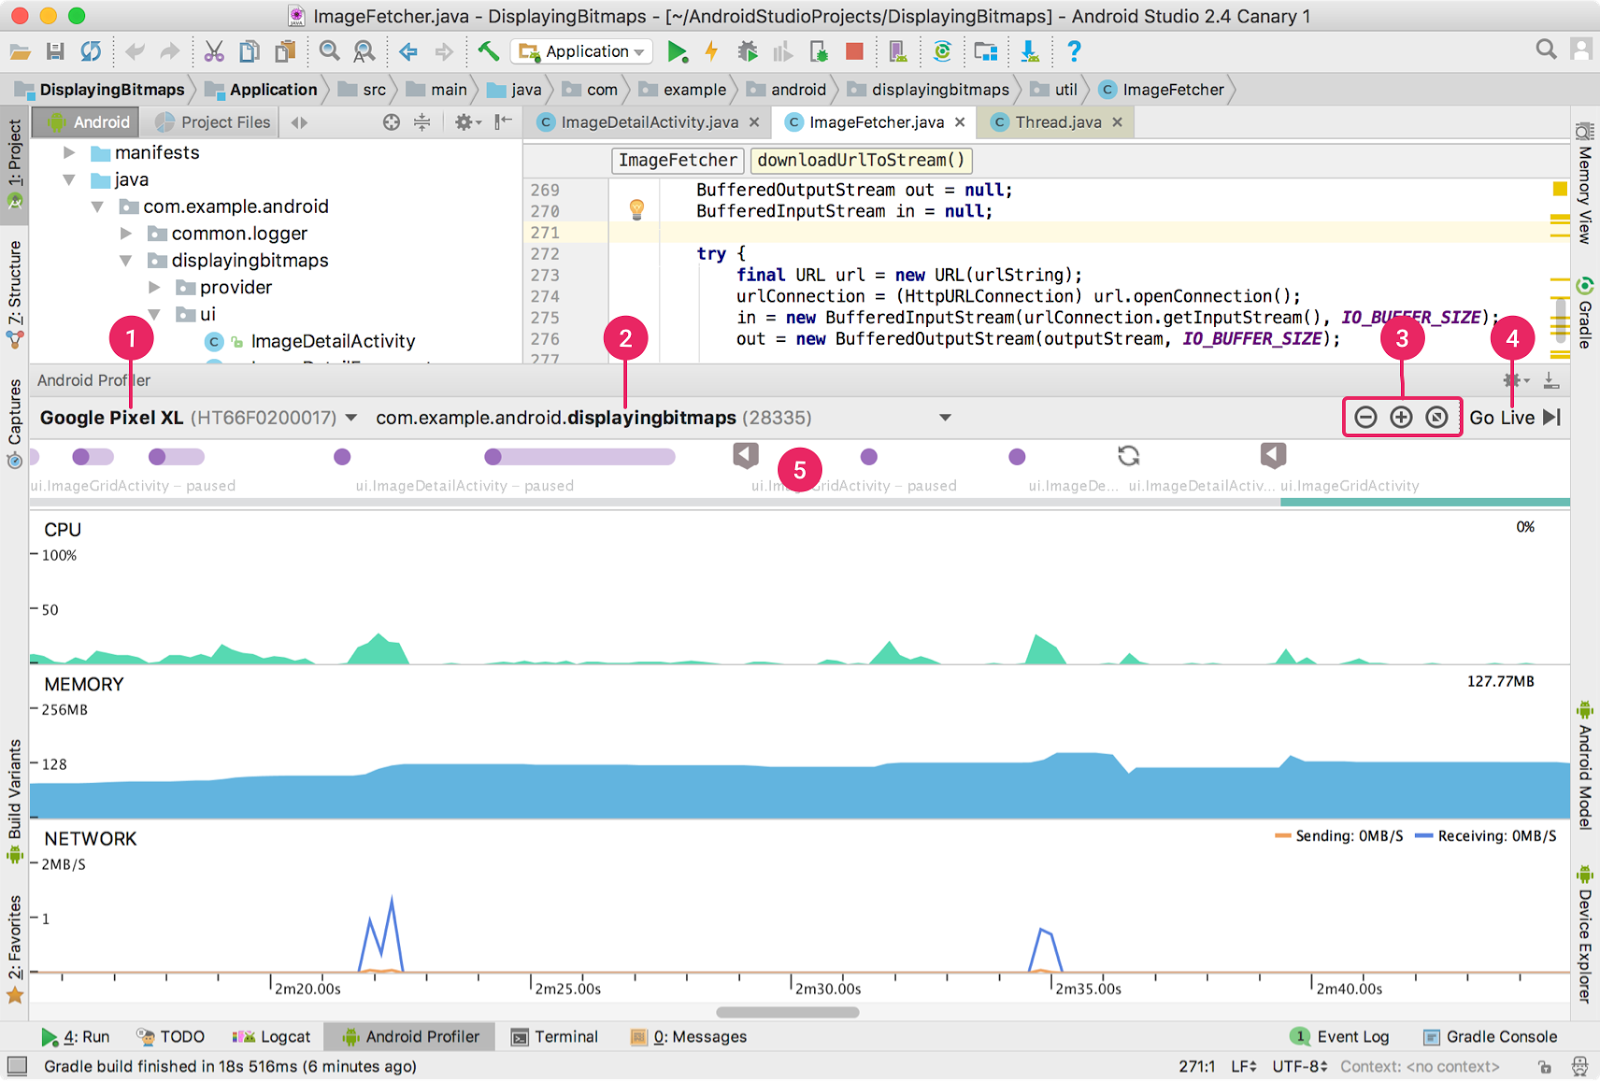
The meaning of the numbers in the screenshot:
- Dropdown for selecting the device.
- Dropdown for selecting the app process you want to profile.
- Timeline zoom controls.
- Button to jump to the realtime data, for example after scrolling to inspect previous data.
- Event timeline that shows the lifecycle of activities, all input events, and screen rotation events. This timeline can help you relate what you see in the graphs to areas of your code.
The event timeline shows three monitors:
- The Memory Profiler (the MEMORY area in the screenshot) shows you a realtime count of allocated objects and garbage collection events. It also allows you to capture heap dumps and record memory allocations.
- The CPU Profiler (the CPU area in the screenshot) shows realtime CPU usage for your app process and system-wide CPU usage.
- The Network Profiler (the NETWORK area in the screenshot) displays realtime network activity. It shows data sent and received, as well as the current number of connections. You can also see the event timeline and radio power state (high/low) vs Wi-Fi.
Read the Android Profiler documentation to learn more about using the monitors, and do the performance practicals to experiment with them.
Learn more
Android developer documentation:
- Best Practices for Performance
- Performance Profiling Tools (the landing page for all the tools)
- Android Profiler
- Search developer.android.com for "performance" for a full list of the latest performance docs.
Articles:
Video and community: