4.2: Memory
Contents:
- Memory in Android
- Garbage collection
- Memory leaks and memory churn
- The Memory Profiler tool
- Related practical
- Learn more
Android manages memory for you, but if your code uses memory inefficiently, all of Android's management cannot make your app perform well. Cleaning up memory resources takes time, which takes precious milliseconds away from other processes.
Memory is a huge topic. Teaching you the general basics, as well as the deep intricacies, is beyond the scope of this course. This chapter provides Android-related background, introduces the tools used in the practical, and describes common memory-related problems seen in apps.
Memory in Android
Android is a managed-memory environment. You don't have to manually manage memory, because the system does it for you. The Android Team has put a lot of work into making memory management as fast and efficient as possible.
The Android runtime (ART) (5.0/API 21) and Dalvik virtual machine use paging and memory mapping to manage memory. When an app modifies a memory by allocating new objects or touching memory-mapped pages, the memory remains in RAM and cannot be paged out. The only way to release memory from an app is to release object references that the app holds, making the memory available to the garbage collector.
Learn more about ART and Dalvik. Get a refresher on Memory Management in Java.
Garbage collection
The process of cleaning up and freeing memory resources is called garbage collection .
A managed-memory environment, like the ART or Dalvik virtual machine, keeps track of each memory allocation. When the system determines that a piece of memory is no longer used by the program, it frees the memory back to the heap, without your intervention. Garbage collection has two goals:
- Find data objects that are no longer referenced and therefore cannot be accessed in the future.
- Reclaim the resources used by those objects.
Garbage collection is a necessary process, but if it happens too often, it can seriously impact your app's performance. Even though garbage collection can be quite fast, it can still affect your app's performance. You don't generally control when a garbage collection event occurs from within your code.
The system has criteria for determining when to perform garbage collection. When the criteria are satisfied, the system begins garbage collection. If garbage collection occurs in the middle of an intensive processing loop such as an animation or during music playback, it can increase processing time. This increase can push code execution time past the recommended 16-millisecond threshold for efficient and smooth frame rendering.
Your code flow may force garbage collection events to occur more often than usual or make them last longer than normal. For example, if you allocate multiple objects in the innermost part of a for-loop during each frame of an alpha-blending animation, you might pollute your memory heap with a lot of objects. In that circumstance, the garbage collector executes multiple garbage collection events and can degrade the performance of your app.
To maintain a functional multitasking environment, Android sets a hard limit on the heap size (the potentially available memory for each app). The exact heap size varies based on how much RAM the device has available overall. If your app has reached the heap capacity and tries to allocate more memory, it can receive an OutOfMemoryError object.
Android tries to share RAM pages across processes. For details, see Sharing Memory. To learn how to properly determine your app's memory use, see Investigating Your RAM Usage.
For more about Android garbage collection, see Garbage collection in the Android documentation. For general information about garbage collection, see the Garbage collection article on Wikipedia.
Switching apps
Apps in the foreground are visible to the user or are running a foreground service such as music playback. When a user switches between apps, Android keeps apps that are not in the foreground in a least-recently-used (LRU) cache. For example, when a user first launches an app, a process is created for the app, but when the user leaves the app, that process does not quit. The system keeps the process cached. If the user returns to the app, the system reuses the process, which makes app switching faster.
If your app has a cached process, and it retains memory that it currently does not need, then your app—even while the user is not using it—affects the system's overall performance. As the system runs low on memory, the system kills processes in the LRU cache, beginning with the process least recently used. The system also accounts for processes that hold onto the most memory and can terminate them to free up RAM.
For more information, see the Processes and Threads guide.
Memory leaks and memory churn
Memory leaks: A memory leak happens when your code allocates memory for objects, but never frees that memory. Over time, the memory allocated for these objects acts as a large, immovable block, forcing the rest of the app to operate in what's left of the heap. Eventually, the app can run out of memory and crash. Memory leaks can be huge and obvious, such as when your app loads an image that is larger than available memory. Memory leaks can also be tiny and hard to find, because the user will only notice the app getting slower and slower over time. The ultimate result of memory leaks is when the app runs out of available memory and, from the user's perspective, "suddenly crashes after running just fine for a long time."
Memory churn: Memory can also become tight if you allocate and free a large number of objects in a short time, saturating your heaps, and starting more garbage collections as a result. For example, memory churn can happen if you allocate new objects in the middle of nested loops, or in onDraw() methods. Even if the app does not run out of memory, the user will notice slowdown or stuttering of the app due to the frequent garbage collection.
To avoid memory leaks and churn:
Don't leak
Viewobjects.- Do not reference views from outside the UI thread. If a view is unused but still referenced, this view and its whole subhierarchy of children cannot be freed. Views have references back to their activities, so if a view cannot be freed, its whole associated activity also stays in memory. And because activities are re-created when the user changes the orientation of their device, a lot of no-longer-used objects stay around.
- Do not reference a view in an async callback. The view cannot be freed until the task is done, and the view may be invalid anyway, by the time the
AsyncTaskcompletes. - Do not reference views from static objects. Static objects stay around for the lifetime of the process, which can be a lot longer than the activity.
- Don't put views into collections, such as
WeakHashmap, that don't have clear memory patterns. - For more information, watch the Do Not Leak Views video.
- Avoid looping allocations. Do not allocate objects in inner loops. Do it outside the loop, or redesign to avoid allocation in the first place.
- Avoid allocating objects in the
onDraw()methods of your custom views. TheonDraw()method is called on every frame. - Use object pools. Allocate a group of objects and reuse them. Object pools are data structures which hold on to unused objects for you. Rather than free an object back to the heap when you're done with it, you hand the object off to the object pool. Later, when some function wants a new object of that type, you can request an object from the pool, rather than allocating a new one from the heap. Android provides the
Poolclass. However, if you use pools, you have to manage your own memory for these objects. Learn more with the Object Pools video.
To learn more, watch the Performance Cost of Memory Leaks and Memory Churn and Performance videos.
The Memory Profiler tool
The Memory Profiler is a component of the Android Profiler. With the Memory Profiler you can
- view a real-time count of allocated objects and garbage collection events on a timeline,
- capture heap dumps,
- record memory allocations.
To start Memory Profiler (see image below):
- Run your app on a device with Developer options enabled.
- In Android Studio, open the Android Profiler (1) from the bottom toolbar.
- Select your device and app, if they are not already selected (2). The MEMORY graph starts to display (3).

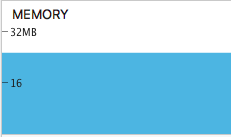
When you first open the Memory Profiler, the timeline shows the total amount of memory used by your app. Memory size is shown on the y-axis.

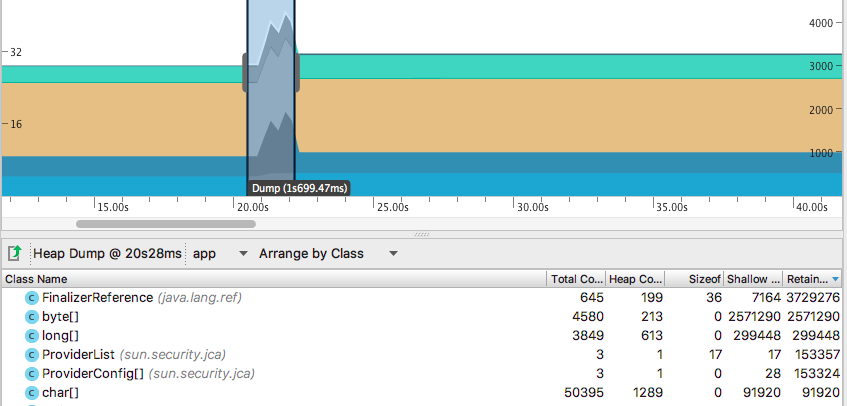
Click on the memory bar, and the graph expands into memory types. Each memory type (such as Java, native, and graphics) is shown with a different color in a stacked Memory graph. The legend above the graph shows the amount of each type of memory.

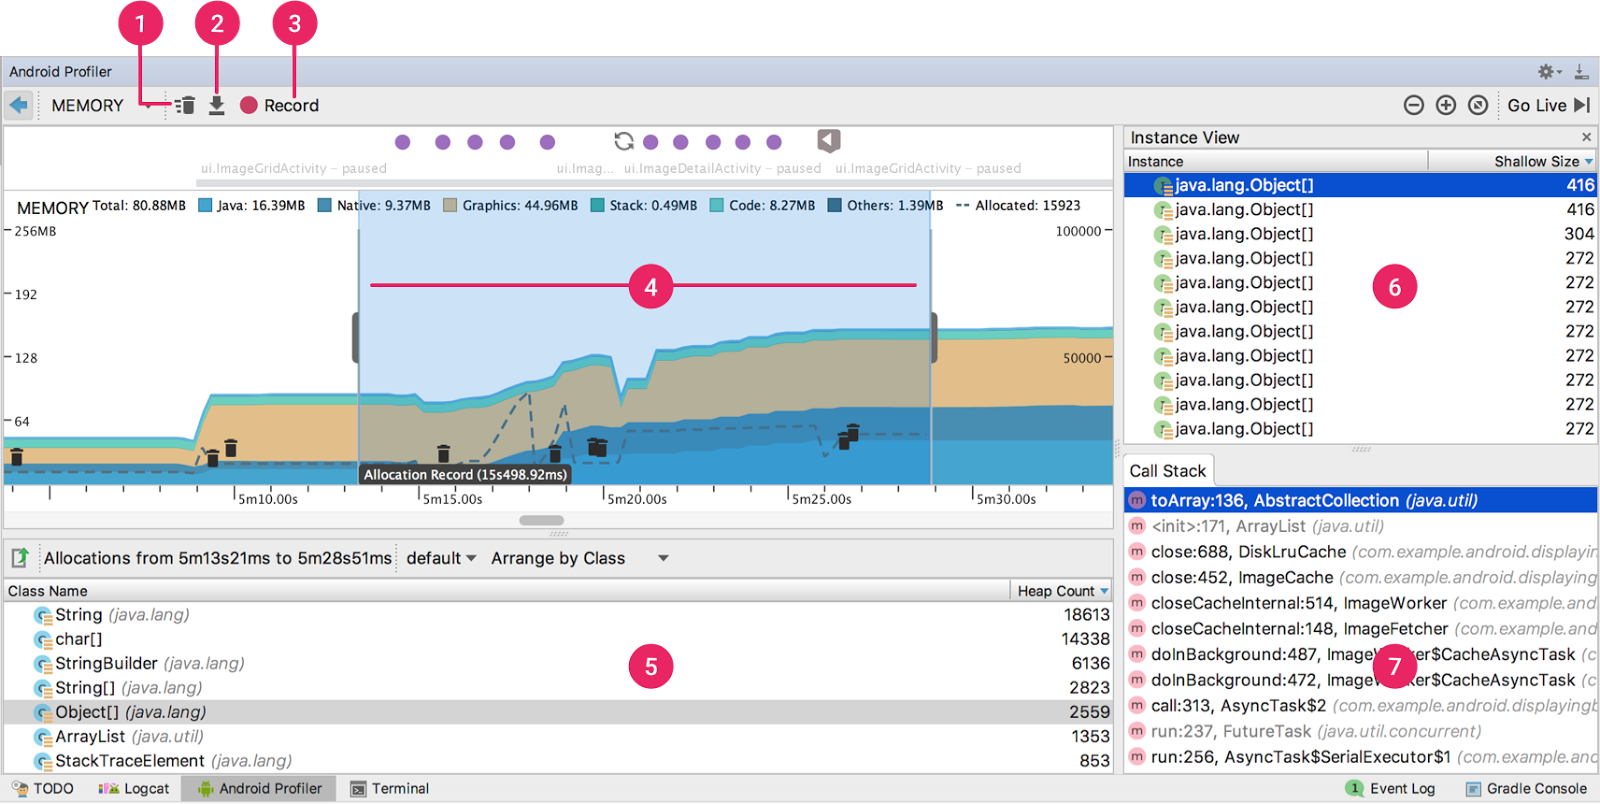
The figure and explanations below summarize the tools and functionality available in the Memory Profiler. See the Memory Profiler documentation and the Memory Profiler practical for details on how to use this tool.

Legend for the image:
- (1) Force garbage collection.
- (2) Capture a heap dump.
- (3) Record memory allocations.
- (4) The period of time during which memory allocations were recorded.
- (5) Memory allocation results during the time indicated in the timeline. When viewing either a heap dump or memory allocations, you can select a class name from this list to view the list of instances on the right.
- (6) Click a class name to populate the Instance View.
- (7) Click on an instance to display its Call Stack. When you are viewing the allocation record, the Call Stack shows the stack trace for where that memory was allocated. When you are viewing a heap dump, the Call Stack shows the remaining references to that object.
To export the recordings to an hprof file (for heaps) or an alloc file (for allocations), click the Export
 button in the top-left corner of the Heap Dump or Allocations pane. Load the file into Android Studio later for exploration.
See the HPROF documentation for details on the user interface and more on working with HPROF files.

Related practical
The related exercises and practical documentation is in Memory Profiler.
Learn more
- Android Profiler overview
- Memory Profiler
- Overview of Android Memory Management
- Understanding Memory Management (Java)
- Garbage collection (generic)
- Manage Your App's Memory
- Investigating your RAM Usage
- Loading Large Bitmaps Efficiently
- Handling Bitmaps
- Android Performance Patterns video series
- Garbage Collection in Android
- Do Not Leak Views
- Memory and Threading
- Object Pools