4.2: Using the Memory Profiler tool
Contents:
- What you should already KNOW
- What you will LEARN
- What you will DO
- App overview
- Task 1. Run the Memory Profiler tool
- Task 2. Dump and inspect the app heap
- Task 3. Record memory allocations
- Solution code
- Summary
- Related concept
- Learn more
All processes, services, and apps require memory to store their instructions and data. As your app runs, it allocates memory for objects and processes in its assigned memory heap. This heap has a limited but somewhat flexible size. The Android system manages this limited resource for you by increasing or decreasing allocatable memory size. The system also frees memory for reuse by removing objects that are no longer used. If your app uses more memory than the system can make available, the system can terminate the app, or the app may crash.
- Memory allocation is the process of reserving memory for your app's objects and processes.
- Garbage collection is an automatic process where the system frees space in a computer's memory by removing data that is no longer required, or no longer in use.
Android provides a managed memory environment. When the system determines that your app is no longer using some objects, the garbage collector releases the unused memory back to the heap. How Android finds unused memory is constantly being improved, but on all Android versions, the system must at some point briefly pause your code. Most of the time, the pauses are imperceptible. However, if your app allocates memory faster than the system can collect unused memory, your app might be delayed while the collector frees memory. The delay could cause your app to skip frames and look slow.
Even if your app doesn't seem slow, if your app leaks memory, it can retain that memory even while in the background. This behavior can slow the rest of the system's memory performance by forcing unnecessary garbage-collection events. Eventually, the system is forced to stop your app process to reclaim the memory. When the user returns to your app, the app must restart completely.
To help prevent these problems, use the Memory Profiler tool to do the following:
- Look for undesirable memory-allocation patterns in the timeline. These patterns might be causing performance problems.
- Dump the Java heap to see which objects are using memory at any given time. Dumping the heap several times over an extended period can help you identify memory leaks.
- Record memory allocations during normal and extreme user interactions. Use this information to identify where your code is allocating too many or large objects in a short time, or where your code is not freeing the allocating objects and causing a memory leak.
For information about programming practices that can reduce your app's memory use, read Manage Your App's Memory.
What you should already KNOW
You should be able to:
- Create apps with Android Studio and run them on a mobile device.
What you will LEARN
You will learn how to:
- Use Memory Profiler to collect data about your app.
- View Memory Profiler reports.
- Dump the Java heap and inspect it.
- Record memory allocation data for your app.
What you will DO
- Run Memory Profiler and generate, save, and inspect data.
App overview
- You will run the LargeImages and RecyclerView apps from previous practicals, using the Memory Profiler.
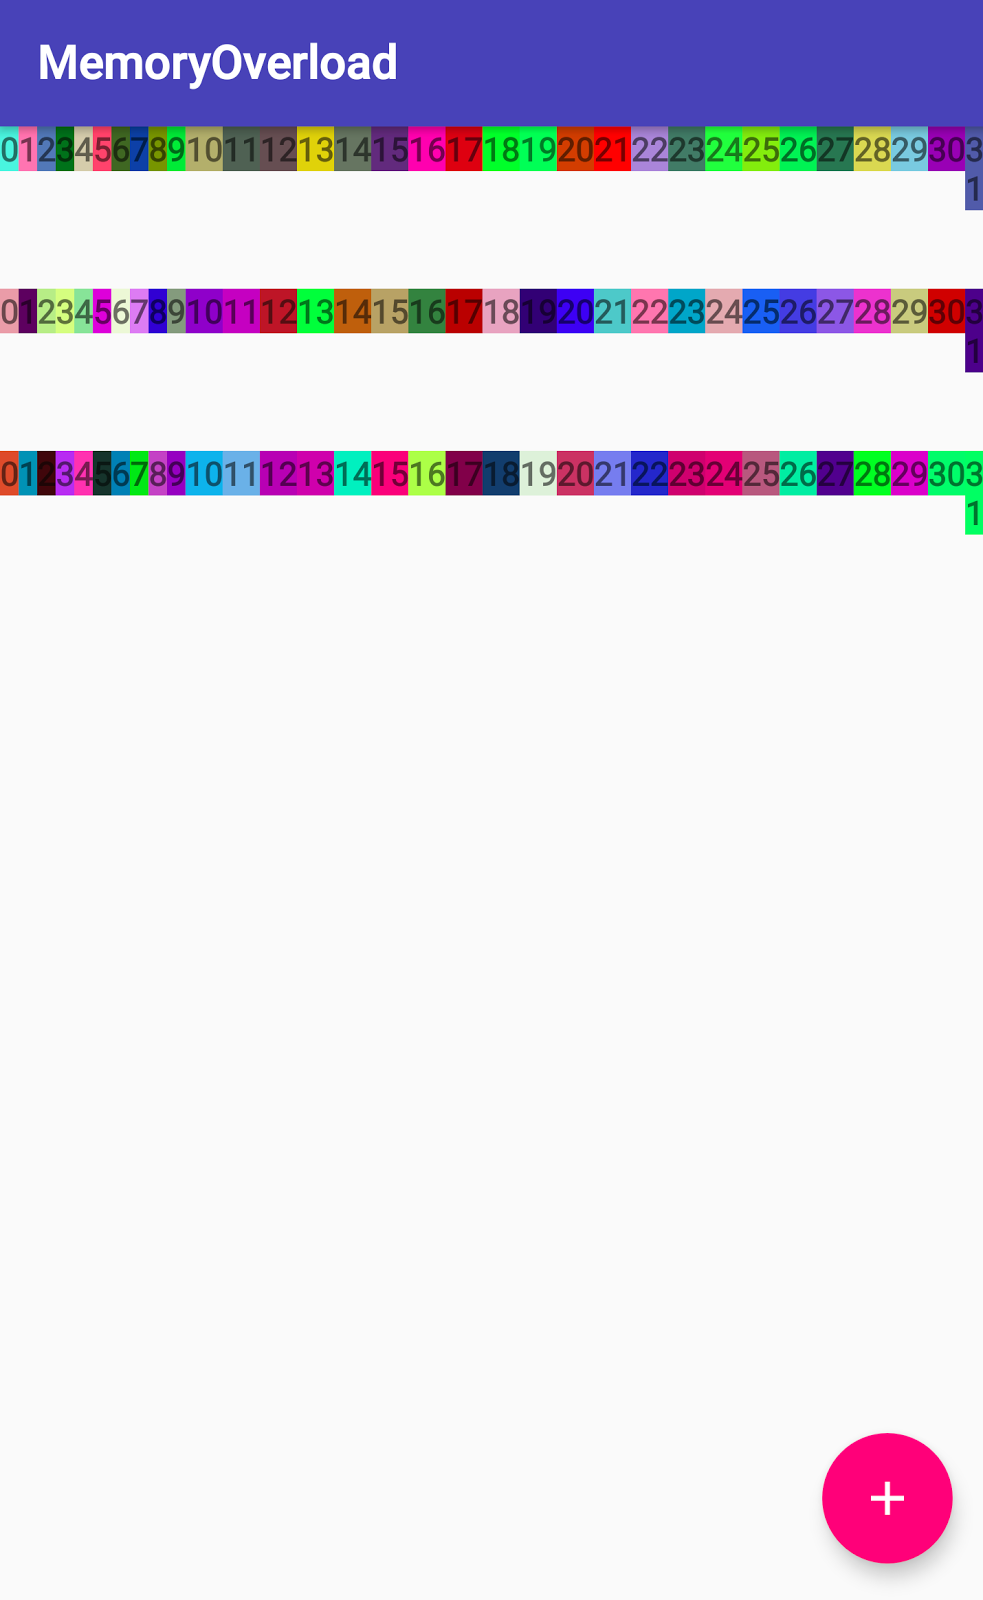
- You will run the MemoryOverload app, which creates thousands of views, eventually using up all available memory.
Task 1. Run the Memory Profiler tool
Android Profiler is a set of tools that provide real-time information about your app, such as memory allocation and network usage. You can capture and view data as your app runs, and store data in a file that you can analyze in various viewers.
In this practical, you learn the basics of using Memory Profiler to track down performance problems and crashes related to your app's memory usage.
If you did any of the previous performance tools practicals, your environment is already set up for debugging with the Android Profiler. Otherwise, see the Prerequisites.
1.1 Start the Memory Profiler tool with the LargeImages app
- Open the LargeImages app in Android Studio.
- Run LargeImages on a device with Developer options and USB Debugging enabled. If you connect a device over USB but don't see the device listed, ensure that you have enabled USB debugging on the device.
For the next steps, use the screenshot below as a reference.
- To open the Android Profiler, at the bottom of Android Studio click the Android Profiler tab (shown as 1 in the screenshot).
Select your device and app, if they are not automatically selected (2 in the screenshot).
The Memory graph starts to display. The graph shows real-time memory use (3). The x -axis shows time elapsed, and the y -axis shows the amount of memory used by your app (4).
In the app, swap the images to see the Memory graph change.
Click in the Memory graph, and the graph expands and separates into memory types. Each memory type (such as Java, Native, and Graphics) is indicated with a different color in a stacked graph. Check the key along the top of the graph to match colors and memory types.

1.2 Read about the Memory Profiler tool
Familiarize yourself with the Memory Profiler user interface, panes, and features with the help of the annotated screenshot below. Not all of these tools are open when you start Memory Profiler.

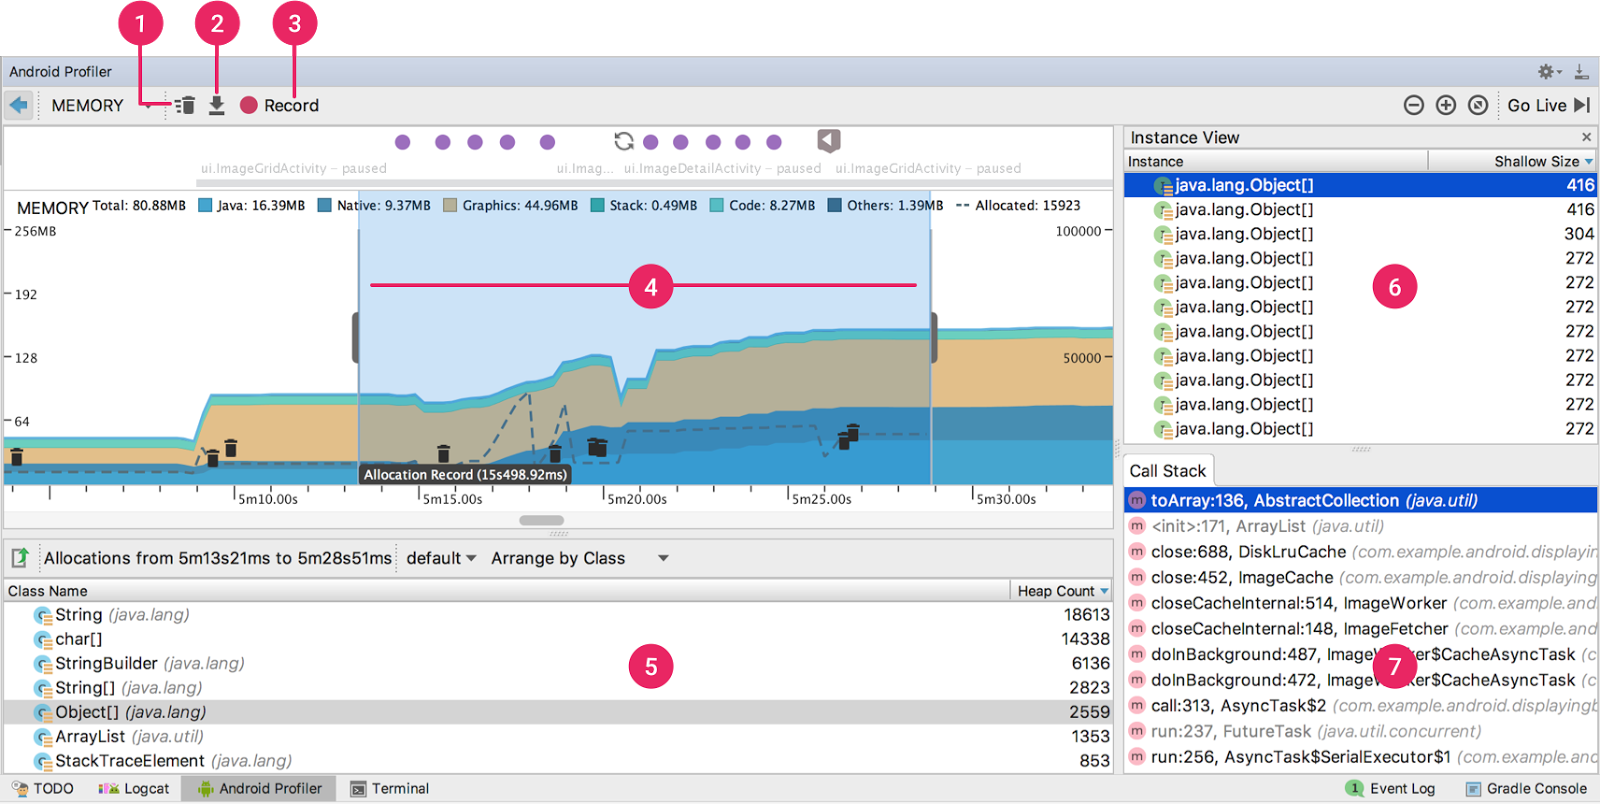
The Memory Profiler panes and features that you use in this practical are shown in the screenshot, as follows:
- (1) Force garbage collection. Small Trash icons in the graph indicate garbage-collection events that you or the system triggered.
- (2) Capture a heap dump and display its contents.
- (3) Record memory allocations and display the recorded data.
- (4) The highlighted portion of the graph shows allocations that have been recorded. The purple dots above the graph indicate user actions.
- (5) Allocation-recording and heap-dump results appear in a pane below the timeline. This example shows the memory allocation results during the time indicated in the timeline.
- (5 and 6) When you view either a heap dump or memory allocations, you can select a class name from this list (5) to view the list of instances on the right (6).
- (7) Click an instance to open an additional pane. When you are viewing the allocation record, the additional pane shows the stack trace for where that memory was allocated. When you are viewing the heap dump, the additional pane shows the remaining references to that object.
See the Memory Profiler documentation for a full list of controls and features.
1.3 Run Memory Profiler for the MemoryOverload app
A memory leak is when an app allocates memory that is never freed, even after the memory is no longer needed. A memory leak can happen when an app allocates many objects and does not free unused or dereferenced objects. Memory leaks can slow down an app or in the worst case, eventually make the app crash. Finding and fixing memory leaks is a lot easier if you have a tool that shows you what's happening with the memory that your app is using.
To demonstrate a memory leak, the MemoryOverload app creates and loads hundreds of TextView objects at the tap of a button. When you run the app and monitor it with Memory Profiler, you see a graph that shows more and more memory being allocated. Eventually, the app runs out of memory and crashes.
- Download the MemoryOverload app.
- Run the app.
- In Android Studio, open the Android Profiler. Click in the Memory graph to see the detail view for Memory Profiler.
- In the app, tap the floating action button (+). Wait until the app is done adding the views to the screen. This may take a while. In Memory Profiler, observe how the app is using more memory as views are added.
Tap the + button a few more times. Your app will generate a graph similar to the one shown below. The graph shows more and more memory used and few, small, or no garbage-collection events. This allocation-graph pattern can indicate a memory leak. (The graph can look very different for different devices.)
Note: You may notice a delay between tapping the plus button and the next batch of views being added. To see just how long it takes, run the Profile GPU Rendering tool, which you enable from within your device's Developer options settings.
Keep adding views until the app crashes and shows an Application Not Responding (ANR) dialog. Logcat displays a message like this one:
03-24 13:05:05.226 10057-10057/com.example.android.memoryoverload A/libc: Fatal signal 6 (SIGABRT), code -6 in tid 10057 (.memoryoverload)SIGABRTis the signal to initiateabort()and is usually called by library functions that detect an internal error or some seriously broken constraint.After overloading and crashing your device, it is a good idea to remove the app from your device and restart your device.
The MemoryOverload app is a made-up example to show a pattern, and it does not follow best practices! However, allocating and not releasing views is a common cause of memory problems. See the Memory and Threading video for more on this topic.
One fix for the MemoryOverload app would be to not create views that are not visible on the screen. A second solution would be to combine views. Instead of creating a view for each rectangle in a row, you could create a patterned background of rectangles and show multiple rectangles in one view.
1.4 Run Memory Profiler for RecyclerView
- Run the RecyclerView app.
- In the app, scroll through the items while Memory Profiler is open.
- Click the floating action button (+) to add a lot more list items You may see changes in memory allocations and some spikes in the graph.
- Scroll through all of the items again.
Notice that the memory bar is flat when you are scrolling.
RecyclerViewis an efficient way of displaying lists, because views that become invisible are reused to display new content as the list is scrolled.
Task 2. Dump and inspect the app heap
2.1 Dump the Java (app) heap
- Run the MemoryOverload app.
- In Android Studio, open the Android Profiler.
- Click the Memory graph to fill the Android Profiler pane with the detailed view.
- In the MemoryOverload app, tap the floating action button (+) once to add a set of views. Wait for the row of views to appear.
- In Android Studio, click the Dump Java Heap button
 to capture the app heap into a file and open the list of classes. This can take a long time. The Heap Dump pane will open after the heap dump is complete.

2.2 Inspect the dumped heap
Do the following to open all the information panes, then refer to the screenshot annotations for an explanation of each pane.
- In the Heap Dump pane (1), find and click the
TextViewclass. This opens an Instance View pane. - In the Instance View pane (2), click one of the
TextViewinstances. This opens a References pane (3). Your screen should now look similar to the screenshot below.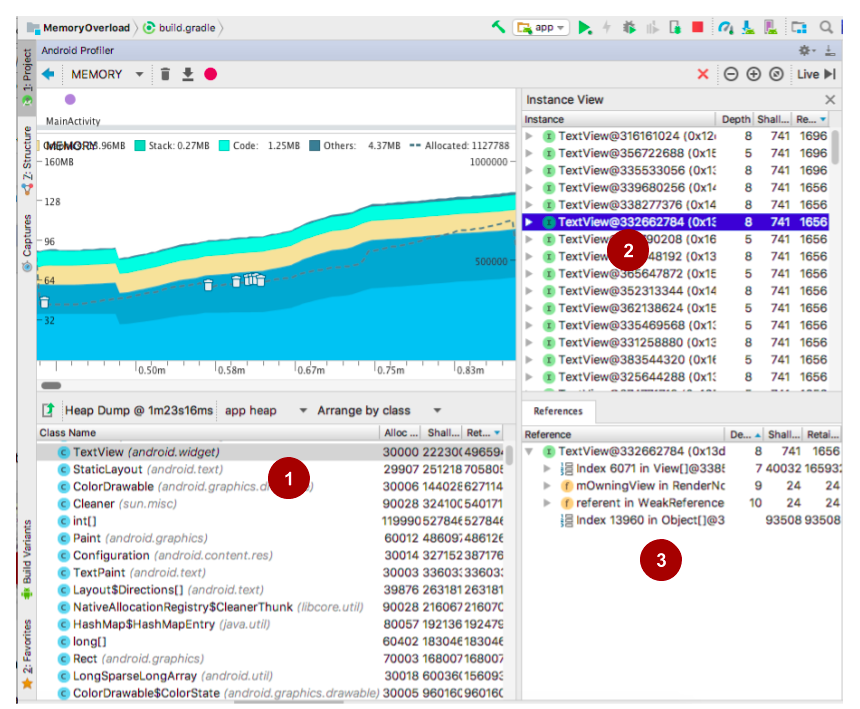
The Heap Dump pane (1) shows all the classes related to your app, as they are represented on the heap. The columns give you size information for all the objects of this class. Click a column header to sort by that metric.
- Allocation Count: Number of instances of this class that are allocated.
- Shallow Size: Total size of all instances of this class.
- Retained Size: Size of memory that all instances of this class are dominating.
After you click the floating action button (+) in the MemoryOverload app, you see a large number of TextView instances on the screen. Corresponding allocations are recorded on the graph and in the allocation count for the TextView class.
The Instance View pane (2) lists all the instances of the selected TextView class that are on the heap. The columns are as follows.
- Depth: Shortest number of hops from any garbage-collection root to the selected instance.
- Shallow Size: Size of this instance, in bytes.
- Retained Size: Total size of memory being retained due to all instances of this class, in bytes.
The References pane (3) shows all the references to the selected instance. For example, in the MemoryOverload app, all the views are created and added to the view hierarchy. When you are debugging an app, look for classes and instances that should not be there, and then check their references.
For example, if you are offloading work to another thread, it is possible that references to views or activities remain after an Activity has been restarted, leaking memory on every configuration change. Look for long-lived references to Activity, Context, View, Drawable, and other objects that might hold a reference to the Activity or Context container.
Right-click a class or instance and select Jump to Source. This opens the source code, and you can inspect it for potential issues.
Click the Export button
 at the top of the Heap Dump pane to export your snapshot of the Java heap to an Android-specific Heap/CPU Profiling file in
 HPROF format. HPROF is a binary heap-dump format originally supported by J2SE. See HPROF Viewer and Analyzer if you want to dig deeper.
See Memory Profiler, Processes and Threads, and Manage Your App's Memory.
Task 3. Record memory allocations
Dumping the heap gives you a snapshot of the allocated memory at a specific point in time. Recording allocations shows you how memory is being allocated over a period of time.
3.1 Record allocations
- Run the MemoryOverload app.
- In Android Studio, open the Android Profiler.
- Click the Memory graph to fill the Android Profiler pane with the detailed view.
Click the Record Memory Allocations button
 .
.

On your device with the MemoryOverload app running, tap the floating action button (+) to add a set of views.
- Wait only a few seconds, then click the Record Memory Allocations button again. The button is now a black square
 indicating that clicking it will pause the recording. Don't wait too long to pause the recording, because the recorded files can get large.
3.2 Inspect recorded allocations
Refer to the screenshot below for the next steps.
- The Memory graph indicates which portion was recorded (1). Select the recorded portion, if necessary. You can record more than one section of the graph and switch between them.
- As in the previous task, the Heap Dump pane (2) shows the recorded data.
- Click a class name to see instances allocated during this period of time (3). As in the previous task, there should be many instances of the
TextViewclass. - Click an instance to see its Call Stack (4).
At the top of the Call Stack (which is actually the bottom...) is the method call in your code that initiated creation of this instance. In this case, the method is
addRowOfTextViews().Click
addRowOfTextViewsto locate this call in your code (5).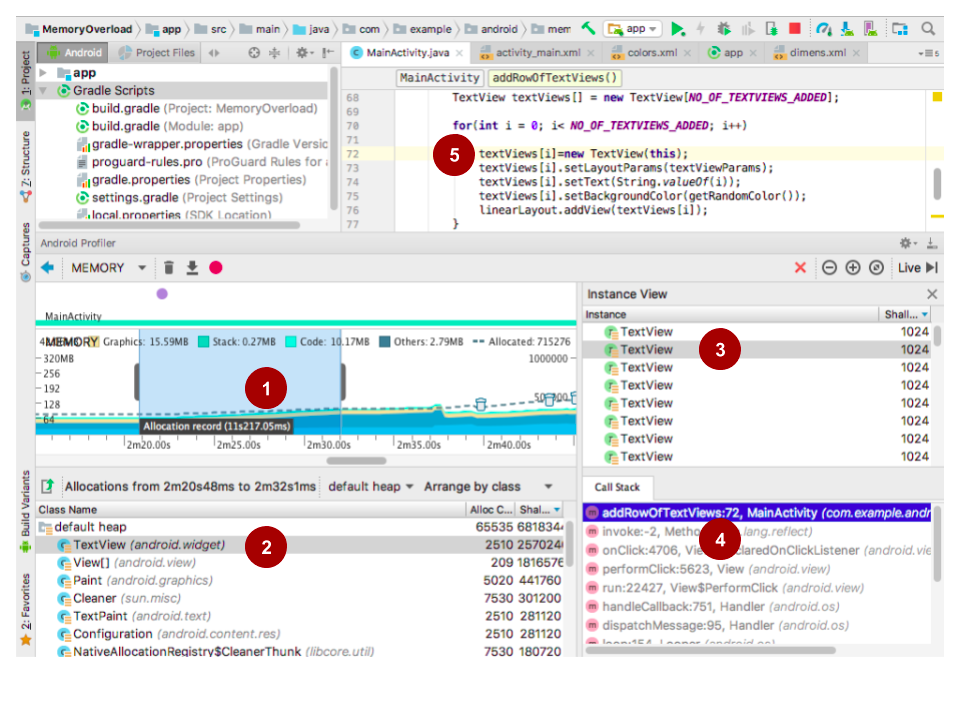
To export the recordings to an hprof file (for heaps) or an alloc file (for allocations), click the Export button
 in the top-left corner of the Heap Dump or Allocations pane. Load the file into Android Studio later for exploration.
Solution code
Android Studio project: MemoryOverload
Summary
- Use Memory Profiler to observe how your app uses memory over time. Look for patterns that indicate memory leaks.
- Use Java heap dumps to identify which classes allocate large amounts of memory.
- Record allocations over time to observe how apps allocate memory and where in your code the allocation is happening.
Related concept
The related concept documentation is in Memory.
Learn more
Android developer documentation:
- Android Profiler overview
- Memory Profiler
- Overview of Android Memory Management
- Manage Your App's Memory
- Investigating your RAM Usage
The Android Performance Patterns video series show older tools but the principles all apply:
