4.3: Optimizing network, battery, and image use
Table of Contents:
- What you should already KNOW
- What you will LEARN
- What you will DO
- App overview
- Task 1. Run the Network Profiler tool
- Task 2. Run battery statistics and visualization tools
- Task 3. Convert images to WebP format
- Summary
- Related concepts
- Learn more
Networking is one of the biggest users of battery. Optimizing your networking by following best practices will reduce battery drain, as well as reducing the size and frequency of data transfers.
In this practical, you learn how to use tools to measure and analyze network and battery performance. You also learn how to compress images to reduce the size of your data stream.
Optimizing network and battery performance is a huge topic, and as devices change, so do some of the details and recommendations. The Android team is constantly improving the framework and APIs to make it easier for you to write apps that perform well.
See the Best Practices: Network, Battery, Compression concept for an essential overview. Make use of the extensive linked resources to dive deeper and get the most up-to-date recommendations.
What you should already KNOW
You should be able to:
- Create apps with Android Studio and run them on a mobile device.
- Work with Developer options on a mobile device.
- Start the Android Profiler.
What you will LEARN
You will learn how to:
- Monitor networking using the Networking Profiler tool.
- Dump and view battery usage using
batterystatsand Battery Historian 2.0. - Convert images to WebP format.
What you will DO
- Run the Networking Profiler tool.
- Dump battery statistics and display them as a chart using Battery Historian 2.0.
- Convert an image to WebP format using Android Studio.
App overview
- You'll use the WhoWroteIt app, or any app of your choice that makes network calls.
- You'll create a simple demo app with a large image and an image converted to WebP format.
Task 1. Run the Network Profiler tool
Android Profiler includes the Network Profiler tool, which makes it possible to track when your app is making network requests in real time. Using the Network Profiler, you can monitor how and when your app transfers data. With this information, you can optimize your code to reduce the frequency of data transfers, and optimize the amount of data transferred during each connection.
In this task you run Network Profiler with the WhoWroteIt app.
1.1 Modify and run the WhoWroteIt app
- Download the WhoWroteIt app and open it in Android Studio.
To help demonstrate the tools, modify the
MainActivity.searchBooks()method of the WhoWroteIt app:- Make multiple calls for each search. This will save you some tedious on-screen typing.
- Call the
sleep()method between requests to ensure that each network call is made separately—that is, to ensure that the system does not batch the calls for you.
Obviously, you should not do either of these things in a production app.
In the
MainActivity.searchBooks()method, replace this code:// If the network is active and the search field is not empty, start a FetchBook AsyncTask. if (networkInfo != null && networkInfo.isConnected() && queryString.length()!=0) { new FetchBook(mTitleText, mAuthorText, mBookInput).execute(queryString); }With this code:
// If the network is active and the search field is not empty, start a FetchBook AsyncTask. if (networkInfo != null && networkInfo.isConnected() && queryString.length()!=0) { new FetchBook(mTitleText, mAuthorText, mBookInput).execute(queryString); SystemClock.sleep(3000); new FetchBook(mTitleText, mAuthorText, mBookInput).execute(queryString); SystemClock.sleep(3000); new FetchBook(mTitleText, mAuthorText, mBookInput).execute(queryString); SystemClock.sleep(3000); new FetchBook(mTitleText, mAuthorText, mBookInput).execute(queryString); SystemClock.sleep(3000); new FetchBook(mTitleText, mAuthorText, mBookInput).execute(queryString); }- Run your app and perform one search. The app's user interface has not changed, and you should see one search result for your query.
1.2 Run the Network Profiler tool
- On your device, turn off Wi-Fi to make sure that your device uses the mobile radio for networking requests. Make sure that mobile data is enabled on the device.
- Run your app on the device. If possible, do this on a physical device to get accurate measurements.
- In Android Studio, open Android Profiler.
Enter a book title in the app and click the Search Books button. The Network Profiler should display a summary graph similar to the one below. The pattern may look different for different devices and network connections.
- Orange spikes indicate data sent, and blue spikes data received. The WhoWroteIt app does not send a lot of data, so the orange spikes are short, while the blue spikes are much taller.
- The horizontal axis moves in time, and the vertical axis shows data transfer rate in kilobytes per second.
- Every time your app makes a network request, a vertical spike on the Network Profiler indicates the activity.
- The width of the base of the spike is how long the request took. The height of the spikes is the amount of data sent or received.

Click the Network Profiler section of the Android Profiler to expand the pane and see more details, as shown in the annotated screenshot below. To keep the graph from moving, click the Live button in the top-right corner of the profiler, or just scroll back. Doing this does not stop the recording.
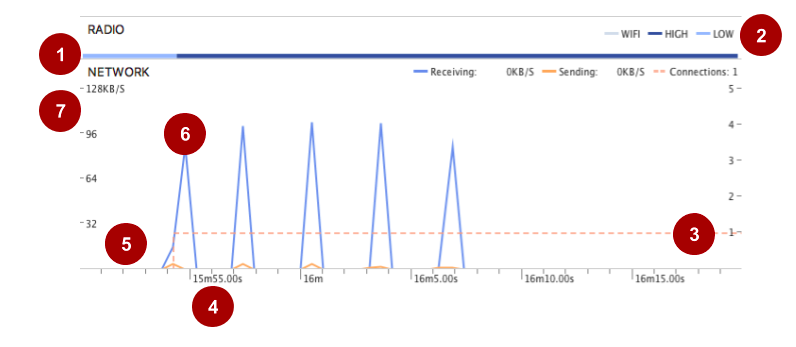
The horizontal colored bar at the top indicates whether the request was made on Wi-Fi (gray) or the mobile radio (dark or light blue). The power state of the mobile radio is indicated by dark blue for high (using more battery power) and light blue for low (using less battery power).
- Legend for type of radio used and power state of mobile radio.
- The orange dotted line indicates the number of active connections over time, as shown on the y -axis on the right.
- The x -axis shows the time that has passed.
- Orange spikes mark data sent. The width indicates how long it took, and the height how much data was sent. The WhoWroteIt app requests are small, so it does not take long to send this small about of data.
- Blue spikes mark data received. The width indicates how long data wa received and the height how much data was received. Depending on how many books match the request, the size of the received data, and how long it takes to receive it, can vary.
The y -axis on the left shows numeric values for the amounts of data in KB per second.
Experiment with different queries to see whether it slightly changes the network request patterns.
1.3 Network Profiler details
To show you advanced profiling data, Android Studio must inject monitoring logic into your compiled app. Features provided by advanced profiling include:
- The event timeline on all profiler windows
- The number of allocated objects in the Memory Profiler tool
- Garbage collection events in the Memory Profiler tool
- Details about all transmitted files in the Network Profiler tool
To enable the advanced profiling in Android Studio, follow these steps:
- Select Run > Edit Configurations.
- Select your app module in the left pane.
- Click the Profiling tab, and then select Enable advanced profiling.
- Now build and run your app again to access the complete set of profiling features. Advanced profiling slows your build speed, so enable it only when you want to start profiling your app.
- Open the Android Profiler tab.
- Click on the Network Profiler graph to open the detail view, then click on it again to open the advanced profiling panes.
- On your connected mobile device, search for a book to get data moving over the network and generate a graph. The example below uses a query for the word "jungle".
Refer to the annotated screenshot below for the next steps.
Scroll back the graph to stop real-time viewing.
Note the purple dot at the top of the pane (1), which indicates a user action. In this case, the action was pressing the Search Books button.
Next to the user action, you see the payload for your request, which in this case consists of the word "jungle" (2).
Select a portion of the graph to get more details about it (3).
A pane opens below the graph listing all the requests and responses with additional information in the selected portion of the graph (4).
Click on a request, and a new pane with three tabs opens (5). By default, you see the contents of the first tab, displaying the contents of the response (6).
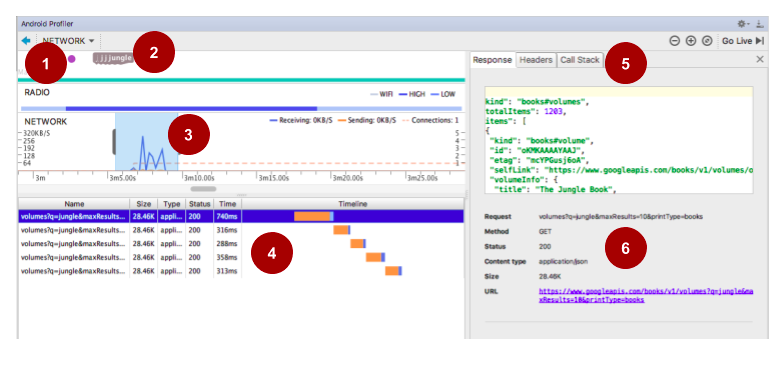
In the screenshot above, notice that the blue bar above the selected portion of the graph remains dark, indicating that the radio is in a high-power state throughout the requests. This is because the requests follow each other closely enough to keep the radio on.
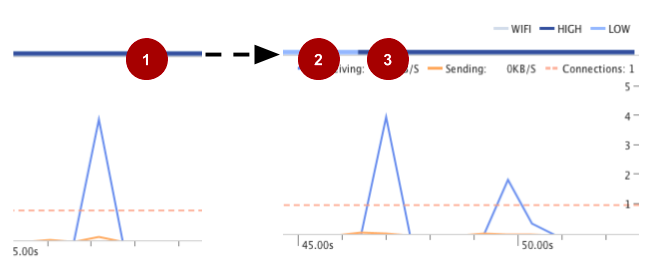
In the WhoWroteIt app, change the sleep time for one of the requests until the radio powers off between requests. How long the mobile radio stays in the high state can vary greatly between devices.
In the screenshot below, after a request, the radio is in the high-power state (1). The radio stays in the high-power state for almost 30 seconds before powering down (2). Then the radio powers up again for the next request (3).
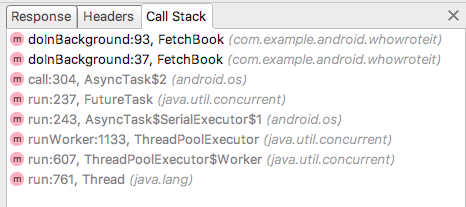
Click the Call Stack tab to see where the request originated in your code. When your app makes many different types of network requests, the Call Stack tab helps you pinpoint where in your code you may want to start optimizing.
When sending requests and receiving responses, try to optimize for power consumption of the mobile radio by minimizing the time the mobile radio is in a high-power state. This can be challenging, and a full explanation is beyond the scope of this practical. However, here are some tips to get you started.
- Limit the size of your requests and responses. Formulate your queries to only request the data you absolutely need.
- Batch your requests so that you can send several of them together without delay to take advantage of the high-power state. Space the sending of requests to maximize for the mobile radio staying in lower power states.
For more best practices, see Optimizing Battery Life and the Best Practices: Network, Battery, Compression concept.
Task 2. Run battery statistics and visualization tools
dumpsys is an Android tool that runs on the mobile device and dumps interesting information about the status of system services as you use the device. The dumpsys command retrieves this information from the device so that you can use it to debug and optimize your app.
You used dumpsys framestats in the Systrace and dumpsys practical.
Batterystats collects battery data from your device, and the Battery Historian tool converts that data into an HTML visualization that you can view in your browser. Batterystats is part of the Android framework, and the Battery Historian tool is open-sourced and available on GitHub. Batterystats shows you where and how processes are drawing current from the battery, and it helps you identify tasks in your app that could be deferred or even removed to improve battery life.
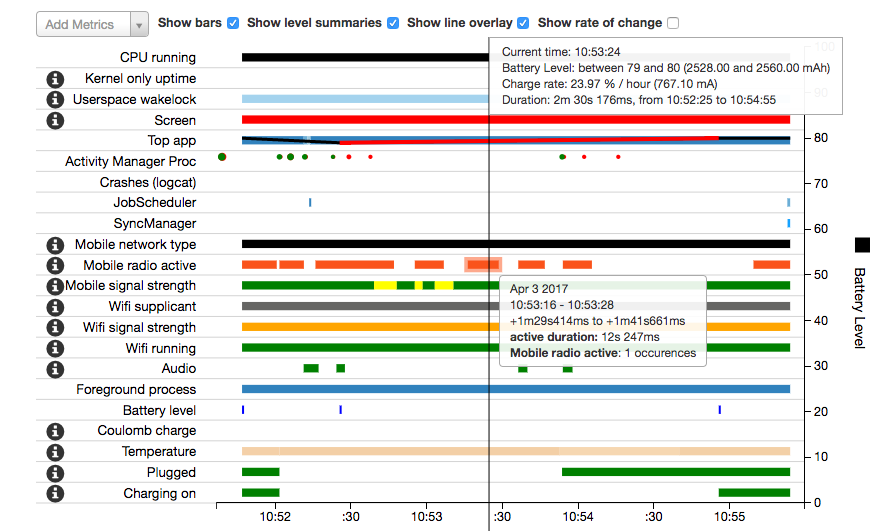
You can use the Battery Historian tool on the output of the dumpsys command to generate a visualization of power-related events from the system logs, as shown in the screenshot below. This information makes it easier for you to understand and diagnose battery-related issues. Battery Historian is not part of the Android framework, and you will need to download and install it from the internet.
In this practical, you create and work with a Battery Historian chart.
2.1 Install the Docker software management platform
The Battery Historian tool is open sourced and available on GitHub.
There are different ways to install the tool. Using Docker is by far the easiest. Docker is an open platform for developers and system administrators to build, ship, and run distributed apps. See the README.md file with the Battery Historian source code on GitHub for more installation options and documentation.
To install and set up Docker:
- On your computer, install the free community edition of Docker from https://www.docker.com/community-edition.
- Start Docker. This may take some time, because more components will download.
- Once Docker is ready, open a terminal window in Android Studio or on your desktop.
- Enter the following commands in the terminal to verify that Docker is installed, running, and working properly:
  docker --version
  docker ps
  docker run hello-world
Read Docker's output, as it summarizes how Docker works.
 docker run hello-world
 Unable to find image 'hello-world:latest' locally
 latest: Pulling from library/hello-world
 78445dd45222: Pull complete
 Digest: sha256:c5515758d4c5e1e838e9cd307f6c6a0d620b5e07e6f927b07d05f6d12a1ac8d7
 Status: Downloaded newer image for hello-world:latest

 Hello from Docker!
 This message shows that your installation appears to be working correctly.

 To generate this message, Docker took the following steps:
  1. The Docker client contacted the Docker daemon.
  2. The Docker daemon pulled the "hello-world" image from the Docker Hub.
  3. The Docker daemon created a new container from that image which runs the
     executable that produces the output you are currently reading.
  4. The Docker daemon streamed that output to the Docker client, which sent it to your terminal.
2.2 Get the Battery Historian tool
- Run the following Docker command.
docker run -p 1234:9999 gcr.io/android-battery-historian/stable:3.0 --port 99991234is the port number for Battery Historian on your localhost. You can replace1234with the port number of your choice. (This might pull the Battery Historian, which might take a while depending on your internet speed.)
READMEfile for Battery Historian in GitHub for the latest version number, because the tool gets updated and improved.
You will see a series of messages in the terminal, similar to the following:
Unable to find image 'gcr.io/android-battery-historian/stable:3.0' locally
3.0: Pulling from android-battery-historian/stable
c62795f78da9: Downloading 12.84 MB/45.56 MB
d4fceeeb758e: Download complete
[...]
e06a9fa76cf2: Pull complete
Digest: sha256:265a37707f8cf25f2f85afe3dff31c760d44bb922f64bbc455a4589889d3fe91
Status: Downloaded newer image for gcr.io/android-battery-historian/stable:3.0
2017/08/04 18:33:34 Listening on port:  9999
Linux and Mac OS X:
- That's it. Open Battery Historian, which will be available in your browser at http://localhost:1234/
Windows:
- You may have to enable virtualization. If you are able to run the emulator with Android Studio, then virtualization is already enabled.
- Once you start Docker, it should tell you the IP address of the machine it is using. If, for example, the IP address is
123.456.78.90, Battery Historian will be available at http://123.456.78.90:1234. (If you used a different port, substitute it in the URL.)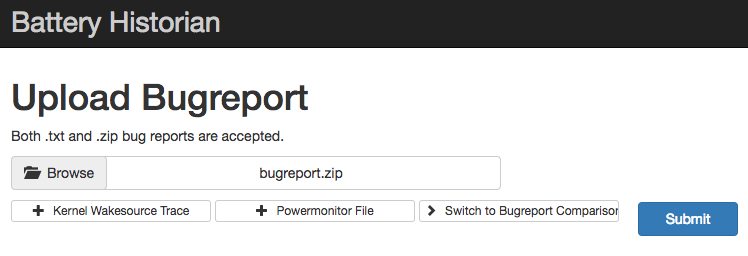
2.3 Run commands to get battery statistics
Your mobile device collects statistics about itself as it runs. This information is useful for debugging as well as performance analysis. The dumpsys batterystats command gets information related to battery usage from your device.
- Connect your mobile device to your computer.
- Turn off device Wi-Fi so that the device uses the mobile radio.
- If you have not already done so, download the WhoWroteIt app and open it in Android Studio.
- Run the WhoWroteIt app on your mobile device.
- On your computer, open a terminal window. (Use the command prompt on a Windows system, or open the Terminal pane in Android Studio.)
- From the command line, shut down your running
adbserver.adb kill-server - Restart
adband check for connected devices. The command lists any connected devices.$ adb devices List of devices attached emulator-5554 device LGH918ce000b4b device - Reset battery data gathering. Resetting erases old battery collection data; otherwise, the output from the dump command will be huge.
adb shell dumpsys batterystats --reset - Disconnect your mobile device from your computer so that you are only drawing power from the device's battery. On the emulator, you will not get accurate data for this exercise.
- Play with the WhoWroteIt app for a short time. Search for different books by using different search text.
- Reconnect your mobile device.
- On your mobile device, turn Wi-Fi on.
- Make sure that
adbrecognizes your mobile device.adb devices - Dump all battery data and redirect the output to save it into a text file. This can take a while.
adb shell dumpsys batterystats > batterystats.txt To create a report from raw data on a device running Android 7.0 and higher:
adb bugreport bugreport.zipFor devices 6.0 and lower:
adb bugreport > bugreport.txtbugreportcould take several minutes to complete. Do not cancel, close the terminal window, or disconnect your device until it is done.On the Battery Historian starting page in your Chrome browser (see previous screenshot), browse for the
bugreport.txtorbugreport.zipfile. Click Submit to upload and display the chart. If you used Terminal pane in Android Studio, thebugreportfile will be located in the WhoWroteIt app's root directory.
2.4 What you see in the Battery Historian chart
The Battery Historian chart graphs power-relevant events over time.
Each row shows a colored bar segment when a system component is active and drawing current from the battery. The chart does not show how much battery was used by the component, only that the app was active.
- Hover over the bars to get details about each graph. You will work more with this in a minute.
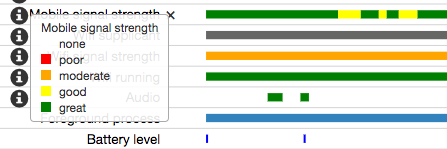
Hover over the "i" information icon on the left to get a color legend, as shown in the figure below.
Using the chart screenshot below and explanations below, explore your chart. Your chart looks different than the screenshot because you are on a different device, and you likely performed different actions.
Chart guidelines
The following chart shows three minutes of information for an LG V20 mobile device running the modified WhoWroteIt app.
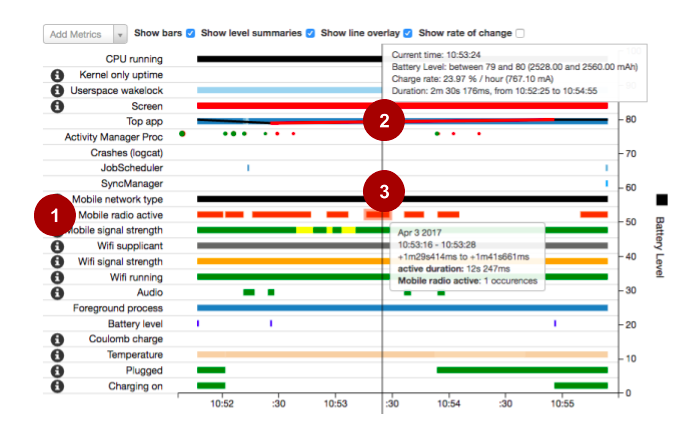
The numbers in the following list reference the numbered callouts in the image below, illustrating some of the powerful information you can gather and analyze.
- (1) The Mobile radio active line shows the activity of the mobile radio. The mobile radio is one of the biggest battery users. When working on battery efficiency, you always want to look at and optimize the mobile radio's activity.
- (2) Movable timeline that displays information about battery charge state. The upper box shows information about the current battery state. The bottom bars show that the device was not plugged in at this moment, and it was not charging. This information is useful when you want to verify that your code only performs certain battery intensive activities, such as syncs, when the device is plugged in and on Wi-Fi.
- (3) Mobile radio activity. The selected bar in the Mobile radio active line, and those nearby, are likely the WhoWroteIt app's network calls to fetch books. The information box for the bar underneath the timeline marker shows additional information such as the duration and the number of occurrences.
See the following documentation for more:
Task 3. Convert images to WebP format
Most download traffic consists of images fetched from a server. The smaller you can make your downloadable images, the better the network experience your app can provide for users. Downloading smaller images means faster downloads, less time on the radio, and potential savings of battery power. Using WebP images with your app sources reduces APK size, which in turn means faster app downloads for your users.
WebP is an image file format from Google. WebP provides lossy compression (as JPG does) and transparency (as PNG does), but WebP can provide better compression than either JPG or PNG. A WebP file is often smaller in size than its PNG and JPG counterparts, with at least the same image quality. Even using lossy settings, WebP can produce a nearly identical image to the original. Android has included lossy WebP support since Android 4.0 (API 14) and support for lossless, transparent WebP since Android 4.3 (API 18).
Serve WebP files over the network to reduce image load times and save network bandwidth.
In general, use the following algorithm to decide which image format to use:
Do you support WebP?
        Yes: Use WebP
        No: Does it need transparency?
                Yes: Use PNG
                No: Is the image "simple" (colors, structure, subject?)
                       Yes: Use PNG
                        No: Use JPG
3.1 Create an app and compare image sizes and quality for different formats
Android has included lossy WebP support since Android 4.0 (API 14) and support for lossless, transparent WebP since Android 4.2 (API 18).
Support for lossless and transparent WebP images is only available in Android 4.2 and higher. That means your project must declare a minSdkVersion of 18 or higher to create lossless or transparent WebP images using Android Studio.
- Create an app with a
minSdkVersionof 18 using the Basic Template. - Add the same large image that you used in the LargeImages app as the background for the text view.
- Make a backup copy of the image in res/drawable. You need the backup because conversion occurs in place, replacing your original image.
In your
res/drawablefolder, right-click the image and choose Convert to WebP at the bottom of the menu. The Convert Images to WebP dialog opens.This conversion happens "in-place"; that is, your original image is changed into the compressed image.
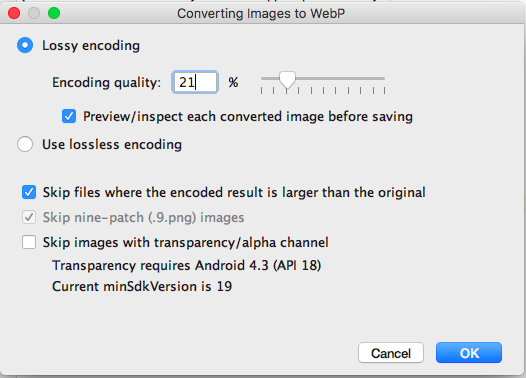
Choose Lossy encoding, move the slider to 21%, and click OK to preview the files. For this particular image, these settings will give you about 10% of the size for the converted image. This saves you over 350 K!
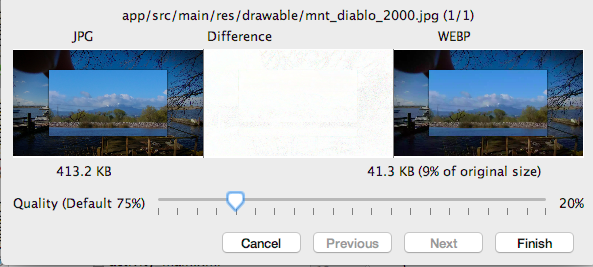
Click Finish to save the converted small image and rename it to
mnt_diablo_webp.webp.- Add an
onClick()handler to the text view that swaps the background between the backed up original and the WebP image. - Run your app.
- Click to swap between the two images. Do you notice any difference in quality? In most cases the difference should be unnoticeable to casual user.
Summary
- Network Monitor gives you a quick live look at how your app is making network requests.
- The
dumpsys batterystatscommand gets battery-related information from your mobile device. - The Battery Historian tool displays the
batterystatsinformation as an interactive time chart. You can use the chart to correlate battery usage with activities taken by your app.
Related concepts
The related concept documentation is in Best Practices: Networking, Battery, Compression with extensive references to more documentation.
Learn more
Performance is a huge and important topic, and there are many resources for you to dive deeper.
Network:
- Android Profiler
- Inspect Network Traffic with Network Profiler
- Connectivity for billions
- Managing Network Usage
- Battery Drain and Networking (video)
- Transferring Data Without Draining the Battery: in-depth docs
Battery:
Batterystatsand Battery Historian Walkthrough- Battery Historian Charts
- Analyzing Power Use with Battery Historian
- Optimizing Battery Life: in-depth docs
- Battery Performance 101 (video)
- Battery Drain and Wake Locks (video)
- Battery Drain and Networking (video)
WebP:
