4.1C: Using the Systrace and dumpsys tools
Contents:
- What you should already KNOW
- What you will LEARN
- What you will DO
- App overview
- Task 1. Run the Systrace tool to analyze the WordListSQL app
- Task 2. Run the Systrace tool to analyze the LargeImages app
- Task 3. Run the dumpsys tool
- Coding challenge
- Summary
- Related concept
- Learn more
Systrace (Android System Trace) captures and displays execution times of your app's processes and other Android system processes, which helps you analyze the performance of your app. The tool combines data from the Android kernel such as the CPU scheduler, disk activity, and app threads. The tool uses this data to generate an HTML report that shows an overall picture of an Android-powered device's system processes for a given period of time.
Systrace is particularly useful in diagnosing display problems when an app is slow to draw or stutters while displaying motion or animation.
dumpsys is an Android tool that runs on the device and dumps interesting information about the status of system services.
Both of these powerful tools let you take a detailed look at what is happening when your app runs. They produce a huge amount of detailed information about the system and apps. This information helps you create, debug, and improve the performance of your apps.
This practical will help you get started, but fully analyzing Systrace and dumpsys output takes a lot of experience and is beyond the scope of this practical.
What you should already KNOW
You should be able to:
- Create apps with Android Studio and run them on a mobile device.
- Work with Developer Options on a mobile device.
What you will LEARN
You will learn how to:
- Use Systrace to collect data about your app and view its reports.
- Run
dumpsysto get a snapshot of information about app performance.
What you will DO
- Use Systrace to capture information about the WordListSQL app on your device.
- View and navigate the trace output for WordLIstSQL.
- Find the Frames section in the Systrace output and get more information about specific frames.
- Examine the alerts, which show potential performance issues with your code.
- Run a trace of the LargeImages app and identify a problem with the app. Correlate what you find with the earlier Profile GPU Rendering tool output.
- Run the
dumpsystool to get additional information about frames.
App overview
You will not build a new app in this practical. Instead you will use apps from other practicals.
- You need the WordListSQL app. Use the version of the WordListSQL app that you built in the Android Fundamentals Course, or download the app from the WordListSql_finished folder from GitHub.
- You also need the LargeImages app from a previous practical, or you can download the course version of the app from GitHub.
Task 1. Run the Systrace tool to analyze the WordListSQL app
Systrace (Android System Trace) helps you analyze how the execution of your app fits into the many running systems on an Android device. It puts together system and application thread execution on a common timeline.
To analyze your app with Systrace, you first collect a trace log of your app and the system activity. The generated trace allows you to view highly detailed, interactive reports showing everything happening in the system for the traced duration.
You can run the Systrace tool from one of the Android SDK's graphical user interface tools, or from the command line. The following sections describe how to run the tool using either of these methods.
1.1 Prerequisites
To run Systrace, you need:
- Android SDK Tools 20.0.0 or higher, which you already have if you've followed this course.
A mobile device running at least Android 4.1 with USB Debugging enabled in Developer Options. You already have this, if you've followed this course.
- You can run on an emulator for practice, but your trace data may not be accurate.
- Some devices do not have Systrace enabled on the kernel they are running, and you will get an error while generating the trace. In this case, you will need to use an emulator. See this Stack Overflow post if you want to explore deeper.
Python language installed and included in your development computer's execution path. Check your Python installation from a command-line window:
- Mac and Linux:
python -v - Windows:
python
- Mac and Linux:
If you do not have Python installed, follow the instructions for your platform at python.org. You can also find instructions in this Check for Python documentation.
1.2a Run Systrace from Android Device Monitor
The following instructions are for Android 4.2 and higher. If you are running on an older version of Android, follow the instructions on the Analyze UI Performance with Systrace page.
- If you don't already have the WordListSQL app, download the WordListSQL app from the
WordListSql_finishedfolder on GitHub. Open the app in Android Studio and run it on your device. - From Android Studio, choose Tools > Android > Android Device Monitor. If you have instant run enabled, you may be asked to Disable ADB Integration. Click Yes.
Android Device Monitor launches in a separate window.
adb as root in order to get a trace. Type adb root at the command line.
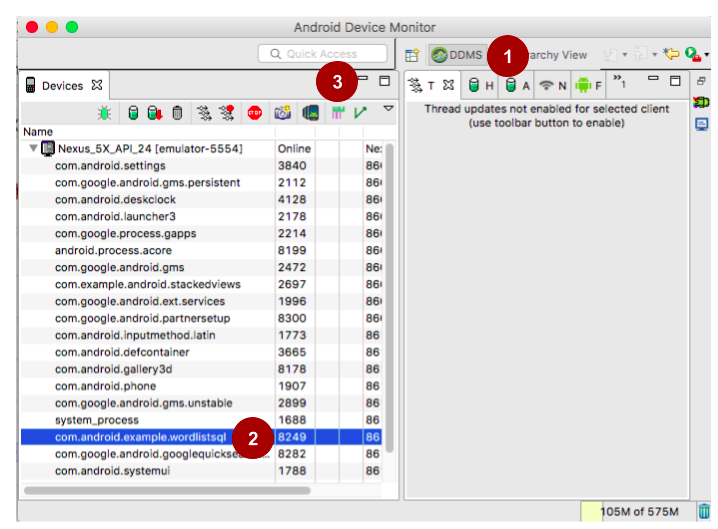
Follow the steps as illustrated in the screenshot below:
Click
 DDMS if it is not already selected. (1) in the screenshot below.
Select your app by package name in the Devices tab. (2) in the screenshot below.
Click the Systrace button
 to initiate the trace. (3) in the screenshot below.
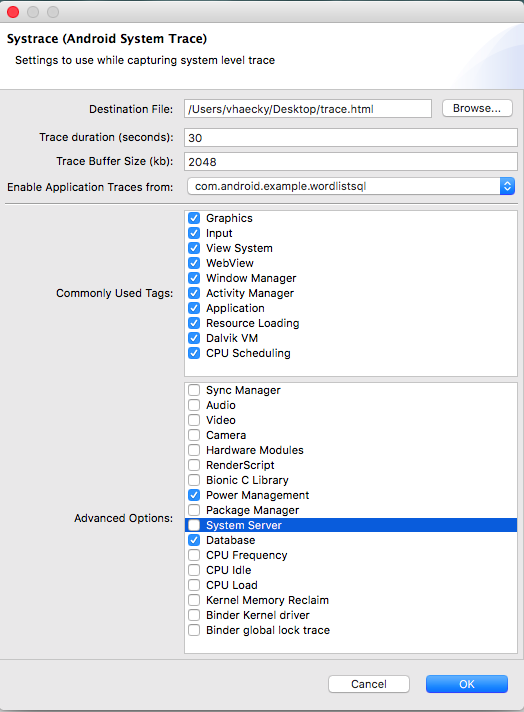
In the Systrace (Android System Trace) pop-up, choose your settings for the trace.
- Destination File: Where the trace is stored as an HTML file. Default is in your home directory with the filename
trace.html. - Trace duration: Default is 5 seconds, and 15-30 seconds is a good time to choose.
- Trace Buffer Size: Start with the default.
- Enable Application Traces from: Make sure your app is visible and selected.
- Now select tags to enable. Choose all the Commonly Used Tags. In the Advanced Options, choose Power Management and Database. Use fewer tags to limit the size and complexity of the trace output.
- Destination File: Where the trace is stored as an HTML file. Default is in your home directory with the filename
Click OK to start tracing. A pop-up appears, indicating that tracing is active.
- Interact with the WordListSQL app on your device. Create, edit, and delete an item.
- When time is up, the pop-up closes, and your trace is done.
1.2b [Optional] Run Systrace from the command line
If you prefer, you can run Systrace from the command line of any terminal window in Android Studio or on your desktop. The following steps use a terminal in Android Studio.
The following instructions are for Android 4.3 and higher. If you are running on an older version of Android, follow the instructions in the systrace user guide.
To run Systrace from the command line:
- In Android Studio, open the Terminal pane, for example, by selecting View > Tool Windows > Terminal.
In the terminal, change directory to where Systrace is located in the Android SDK:
cd <android-sdk>/platform-tools/systraceIf you need to find the directory where the Android SDK is installed: In Android Studio, choose Android Studio > Preferences and search for "sdk". Alternatively, open Tools > Android > SDK Manager. The top of the pane has a text field that shows the Android SDK location.
Start Systrace:
python systrace.py --time=10- This runs systrace for 10 seconds, with default category tags, and saves the output HTML file to the
systracedirectory, which is the current directory. - Systrace is written in the Python language.
- The
timeargument is the time to run, in seconds. - See the Systrace documentation for versions and options.
- If you get an error about
serialnot being installed, installserialusing this command:sudo pip install pyserial
- This runs systrace for 10 seconds, with default category tags, and saves the output HTML file to the
Interact with the WordListSQL app on your device until the trace stops, which happens when time is up. Create, edit, and delete an item. If you need more time to perform these actions, run the command with
--time=30, as you did with the Android Device Monitor example above.
Here is an example command-line command and results:
$ cd android-sdk/platform-tools/systrace
$python systrace.py --time=10
These categories are unavailable: disk
Starting tracing (10 seconds)
Tracing completed. Collecting output...
Outputting Systrace results...
Tracing complete, writing results
Wrote trace HTML file: file:///Users/<you>/sdk/platform-tools/systrace/trace.html
1.3 View and explore the Systrace output
Analyzing the whole trace file is beyond the scope of this practical. Systrace is a powerful tool, and the best way to learn is by using it a lot, by spending time looking at all the outputs. In this task, you learn to navigate the trace output and look at the Frames section.
The file generated for WordListSQL is large, and for a more complex app will be even larger. Practice navigating around the file to find information about your app.
- Open one of your saved
trace.htmlfiles in your Chrome browser. At this time, you must use Chrome. Using a different browser may show a blank page. The file should look similar to the one shown below.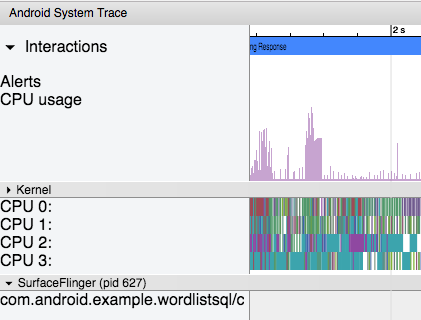
The groupings are in the order Kernel, SurfaceFlinger (the Android compositor process), followed by apps, each labeled by package name. Each app process contains all of the tracing signals from each thread it contains, including a hierarchy of high level tracing events based on the enabled tracing categories.
You can navigate the file using these keyboard controls:
- w—Zoom into the trace timeline.
- s—Zoom out of the trace timeline.
- a—Pan left on the trace timeline.
- d—Pan right on the trace timeline.
- e—Center the trace timeline on the current mouse location.
- g—Show grid at the start of the currently selected task.
- Shift+g—Show grid at the end of the currently selected task.
- Right Arrow—Select the next event on the currently selected timeline.
- Left Arrow—Select the previous event on the currently selected timeline.
- m—Mark this location with a vertical line so you can examine concurrent events in the trace.
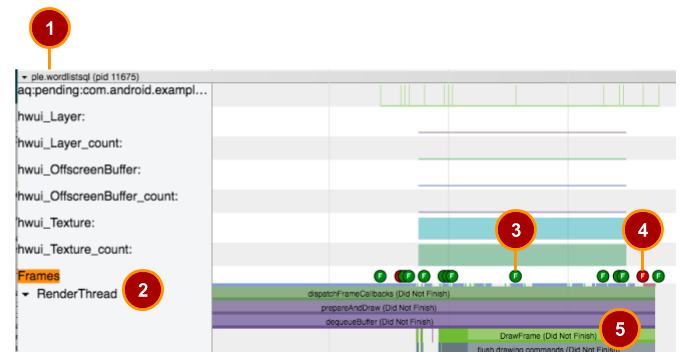
The image shows part of the Systrace output for WordListSQL. The numbers have the following meanings:
- Section for each process
- Frames section
- Frame indicator for frame that rendered successfully
- Frame indicator for frame that did not complete rendering
- Method calls for rendering selected frame
To explore the Systrace output:
- The page has one section for each process that was running when the trace was recorded. Scroll through the very long file and find the section for the WordListSQL app, which is called
ple.wordlistsql (pid .... The results will look different depending on how you interacted with your app, what device you used, and what configuration you used. You may need to scroll down quite a bit. If you get lost, close the tab and reopen the file to start afresh. Tip: Instead of scrolling, you can use the search function of your browser to search for Frames until you find the correct one. - Inside the
ple.wordlistsqlsection, find Frames. In the Frames line, in the graph to the right, you should see circles that are either green or red and are labeled with the letter F for Frame. You may need to zoom in (w on the keyboard) and pan right (d on the keyboard) to see individual, labeled circles.
Select a green circle. This frame is green because it completed rendering in the allotted 16 milliseconds per frame.
Select a red circle. This frame is red because it did not complete rendering within 16 milliseconds.
- In the left-hand pane, scroll down if necessary until you find Render Thread. On devices running Android 5.0 (API level 21) or higher, this work is split between the UI Thread and RenderThread. On prior versions, all work in creating a frame is done on the UI thread. If you do not see Render Thread, select UI Thread instead.
- Click on the black triangle to the right of Render Thread to expand the graph. This expands the bars that show you how much time was spent in each system action involved in rendering this frame.
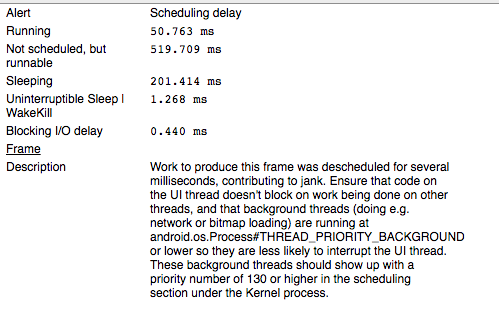
Click on a system action to show more timing information in the pane below the graph. Systrace analyzes the events in the trace and highlights many performance problems as alerts, suggesting what to do next. Below is an example of a frame that was not scheduled, perhaps because the frame was waiting for other work to be completed.
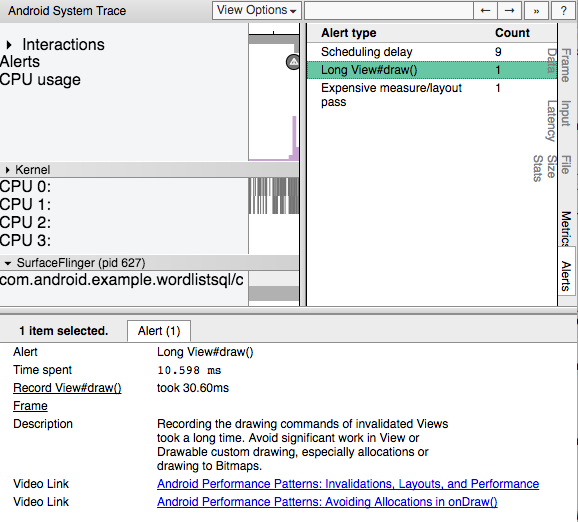
Open the Alerts tab on the right edge of the trace window. Click on an Alert type to see a list of all alerts in the bottom pane. Click an alert to see details, a description of what may be the problem, and links to further resources.
Think of the alerts panel as a list of bugs to be fixed. Often a tiny change or improvement in one area can eliminate an entire class of alerts from your app!
Task 2. Run the Systrace tool to analyze the LargeImages app
2.1 Run Systrace on the LargeImages app
LargeImages is a smaller demo app and the Systrace output will be easier to analyze. In the previous practical, Profile GPU Rendering identified a problem with rendering some of the frames for this app. Use Systrace to get more information about possible causes of the problem. In this case, you may already have guessed what the problem may be. When doing performance analysis, guessing is a valid method of narrowing down your first approach. Be open to having guessed wrong!
- Open the LargeImages app in Android Studio and run it on your connected device.
- Start a Systrace trace that is 10 seconds long either from the command line or Android Device Monitor.
- Flip a few times between the images of the running LargeImages app, going through at least two cycles.
- When it has finished, open the trace in your Chrome browser. This trace should be easier to navigate than the trace from the WordListSQL, because this trace is a lot smaller.
- Find the section for the largeimages process.
- Find the Frames section for LargeImages and expand the UI Thread.
If necessary, zoom (w and s keys on the keyboard) and pan (a and d keys on the keyboard) to see individual frames.

Notice the pattern of green and red frames. This pattern corresponds with the pattern of tall and short bars shown by Profile GPU Rendering in the Profile GPU Rendering practical. Turn on Profile GPU Rendering to refresh your memory, if necessary.
- Click the red circle frame to get more information.
- Looking at the alert information does not tell you specifics about possible causes.
In the Frames section, zoom in so that you can see the system actions on the UI thread that are involved in displaying this frame.

Notice
decodeBitmapand above it, the name of the resource that is being decoded. Decoding the image is taking up all the time AND this decoding is being done on the UI Thread.Now you know the cause of the problem. In a real app, you could address this problem by, for example, using a smaller or lower resolution image.
Task 3. Run the dumpsys tool
dumpsys is an Android tool that runs on the device and dumps information about the status of system services since the app started. You can use dumpsys to generate diagnostic output for all system services running on a connected device. Passing the gfxinfo command to dumpsys provides output in Android Studio's logcat pane. The output includes performance information that relates to frames of animation.
The purpose of this practical is to get you started with this powerful tool. The dumpsys tool has many other options that you can explore in the dumpsys developer documentation.
3.1 Run dumpsys from the command line
- Run the following command to get information about frames.
For example:adb shell dumpsys gfxinfo <PACKAGE_NAME>adb shell dumpsys gfxinfo com.example.android.largeimages - Starting with Android 6.0, you can get even more detailed information using the
framestatscommand withdumpsys. For example, run the following command against a device with Android 6.0 or later:
Learn more about how to use the data generated by this command in the Testing UI Performance andadb shell dumpsys gfxinfo com.example.android.largeimages framestatsdumpsysdocumentation.
dumpsys. Systrace and dumpsys are powerful debugging tools that provide you with a lot of information. Making efficient use of this information takes practice.
Coding challenge
- The tracing signals defined by the system do not have visibility into everything your app is doing, so you may want to add your own signals. In Android 4.3 (API level 18) and higher, you can use the methods of the
Traceclass to add signals to your code. This technique can help you see what work your app's threads are doing at any given time. Learn more at Instrument your app code.
Summary
- Systrace is a powerful tool for collection runtime information about your app, for a slice of time. Use alerts generated by the tool to find potential performance issues. Use the following command. The output is stored in
trace.htmlin thesystracedirectory.$cd android-sdk/platform-tools/systrace $python systrace.py --time=10 - The
dumpsystool collects comprehensive statistics about your app since its start time, including frame rendering statistics. Use these commands:
adb shell dumpsys gfxinfo <PACKAGE_NAME>
adb shell dumpsys gfxinfo <PACKAGE_NAME> framestats
Related concept
The related concept documentation is Rendering and layout.
Learn more
Android developer documentation:
systrace, including a walkthrough and a description of command-line options that are not covered in this practical- Android Profiler
- Testing UI Performance
dumpsys- Instrument your app code
Traceclass andtrace.hFile Reference- Reading Bug Reports
FrameStats
